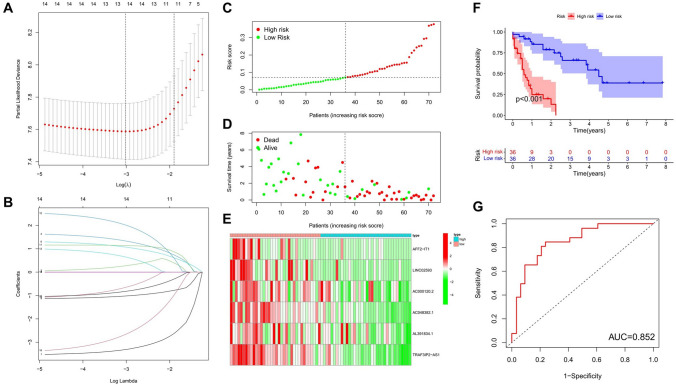
Figure 6.
Risk prediction model for AML patients constructed based on risk-associated signaling of m6A-related lncRNAs, and analysis of prognostic values in training set. (A) Shows the Log Lambda value corresponding to the minimum cross-validation error point. (B) The coefficient of m6A-related lncRNAs varies with the Log Lambda value, and the m6A-related lncRNAs with non-zero coefficient corresponding to the same Log Lambda value in figure A were selected for subsequent model construction. (C) Risk score distribution of the training set based on m6A-related lncRNA risk prediction model. (D) Survival time and status in the high-risk and low-risk groups in the training set. (E) Heatmap showing the expression levels of six m6A-related lncRNAs in the model of each patient from the high-risk and low-risk groups in the training set. (F) Kaplan–Meier curve analysis of OS in the high-risk group and low-risk group in the training set. (G) The ROC curve for predicting the prognoses of patients in the training set.

