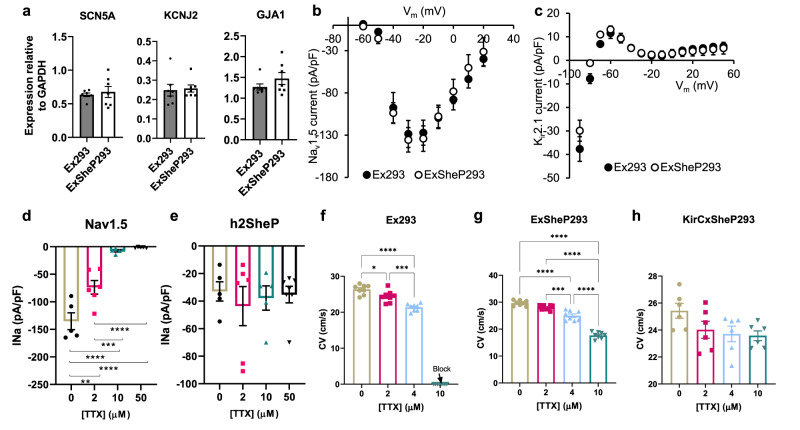
Fig. 3. Effects of BacNav expression in genetically engineered HEK293 cells.
h2SheP was stably expressed in genetically engineered Ex293 line (co-expressing Nav1.5, Kir2.1, and Cx43) to create an ExSheP293 line and KirCx293 line (co-expressing Kir2.1, and Cx43) to create a KirCxSheP293 line. a–c mRNA expression levels of SCN5A, KCNJ2, and GJA1 genes normalized to housekeeping gene GAPDH (a, n = 7), peak INav1.5-V (b, n = 5), or steady-state IK1-V (c, n = 5) curves in Ex293 and ExSheP293 lines showing no effect of h2SheP expression on endogenous channel expression and function. d, e Increasing concentrations of tetrodotoxin (TTX) led to significant reduction in peak Nav1.5 current in Ex293 cells (d, n = 5 for 0 and 10 µM groups, n = 6 for 2 µM group and n = 10 for 50 µM group) but not h2SheP current in KirCxSheP293 cells (e, n = 5 for 0 and 10 µM groups, n = 6 for 2 µM group and n = 10 for 50 µM group), showing differential sensitivity of mammalian and prokaryotic Na channels to TTX. All patch-clamp recordings were performed at 25 °C and peak currents of Nav1.5 and h2SheP were measured at −20 and 0 mV, respectively. **P = 0.0011, 0 µM vs. 2 µM group; ***P = 0.0005, 2 µM vs. 10 µM group; ****P < 0.0001, 0 µM vs. 10 µM, 0 µM vs. 50 µM and 2 µM vs. 50 µM groups in d. f–h Increasing TTX concentrations progressively slowed AP propagation yielding conduction block at 10 μM in Ex293 (f, n = 8) but not ExSheP293 (g, n = 8) monolayers, while no CV slowing was observed in KirCxSheP293 monolayers (h, n = 6). *P = 0.0258, 0 µM vs. 2 µM group; ***P = 0.0006, 2 µM vs. 4 µM group; ****P < 0.0001, 0 µM vs. 4 µM in f. ***P = 0.0004, 2 µM vs. 4 µM group; ****P < 0.0001, 0 µM vs. 4 µM, 0 µM vs. 10 µM, 2 µM vs. 10 µM and 4 µM vs. 10 µM groups in d. Error bars indicate s.e.m; statistical significance was determined by one-way ANOVA, followed by Tukey’s post-hoc test to calculate P-values. Source data are provided as a Source Data file.

