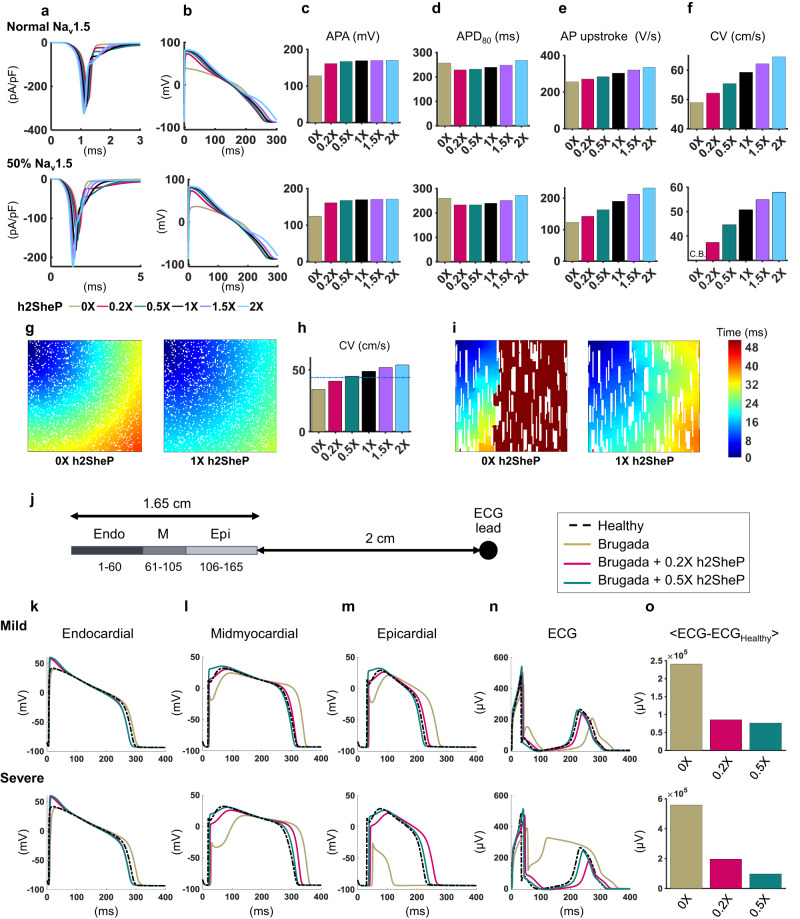
Fig. 5. BacNav improves conduction in simulated adult human ventricular tissues and in a model of Brugada syndrome.
a Combined sodium current (from Nav1.5 and added h2SheP) shown during simulated adult human ventricular myocyte AP for normal (top) and reduced (bottom, 50% of normal Nav1.5 current) excitability. Each trace represents a different h2SheP conductance value utilized for the simulation, with 1X representing h2SheP level that produces the same peak current as endogenous Nav1.5 during voltage-clamp simulation. b–f Corresponding action potential traces generated with different h2SheP expression levels (b) and quantified AP amplitude (APA, c), duration (APD80, d), and maximum upstroke velocity (e) modeled in single cells, as well as conduction velocities (CVs) during AP propagation modeled in 1D cables (f). Note conduction block (C.B.) in 1D cable with reduced excitability in f that is rescued with adding h2SheP. g, h Isochrone activation maps showing AP conduction in a simulated 1 × 1 cm heterogeneous human ventricular tissue with 15% of the total area (1500 total cells shown in white) being randomly disconnected from the rest of the tissue to model nonconducting obstacles akin to tissue fibrosis and quantified CVs for different levels of added h2SheP (h). The obstacle-induced conduction slowing was recovered by the addition of h2SheP (see also Supplementary Movie 1). i Activation maps showing AP conduction block without h2SheP (left) and rescued conduction in the presence of 1× h2SheP (right) in a simulated 1 × 1 cm heterogeneous human ventricular tissue with 20% area consisting of nonconducting vertical anisotropic obstacles (shown in white; see also Supplementary Movie 2). In tissue simulations in g, i, AP conduction was initiated from the top-left tissue corner, with the color bar scale on the far right applying to all activation maps. j Schematics describing simulated transmural ventricular AP conduction (60 endocardial, 45 midmyocardial, and 60 epicardial cells; initiated at the endocardial end) and the location of ECG measurement 2 cm from the epicardial surface. k–o Simulated AP traces (endocardial, k; midmyocardial, l; epicardial, m), ECG traces (n), and corresponding deviations from healthy ECG (o) shown for healthy (dashed line) and mild and severe Brugada cases not treated (0×) or treated with h2SheP at 0.2× or 0.5× expression level.

