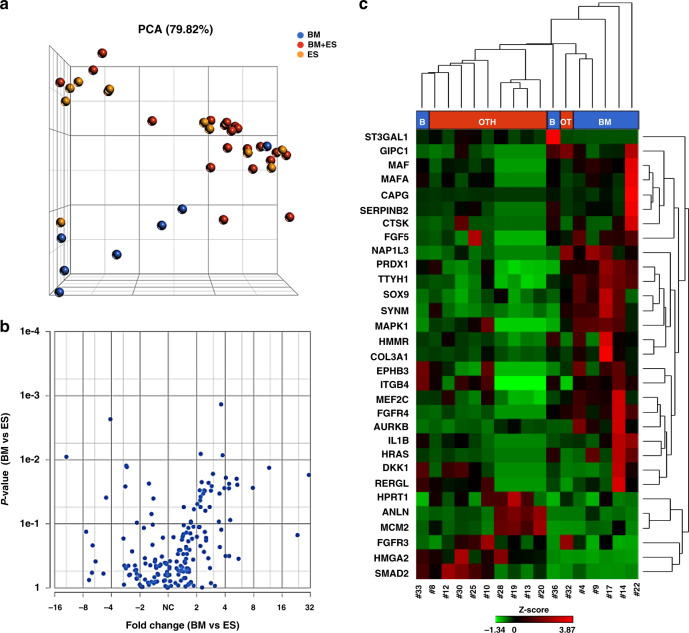
Fig. 1. Targeted RNAseq of CTCs reveals metastasis site-related GEP.
a The PCA, performed to visualise similarities and differences among CTC samples, showed a clear-cut separation of “BM” CTCs (in blue, N = 7) from the others (in yellow: “ES” CTCs, N = 10; in red: “BM + ES” cells, N = 21). In the three-dimensional PCA plot, each sample is represented as a sphere; the closer the spheres in the spreadsheet, the higher the similarity among CTC GEP. b Volcano plot of differential gene expression analysis performed by comparing “BM” vs “ES” CTCs. c The represented heatmap shows the expression profile of the 31 deregulated genes identified by comparing “BM” vs “ES” CTCs (−2 < FC < 2, P ≤ 0.05, FDR < 0.25). BM bone metastases only, BM + ES bone and extra-skeletal metastases, CTCs circulating tumour cells, ES extra-skeletal metastases, FC fold change, FDR false discovery rate, GEP gene expression profile, PCA principal component analysis.

