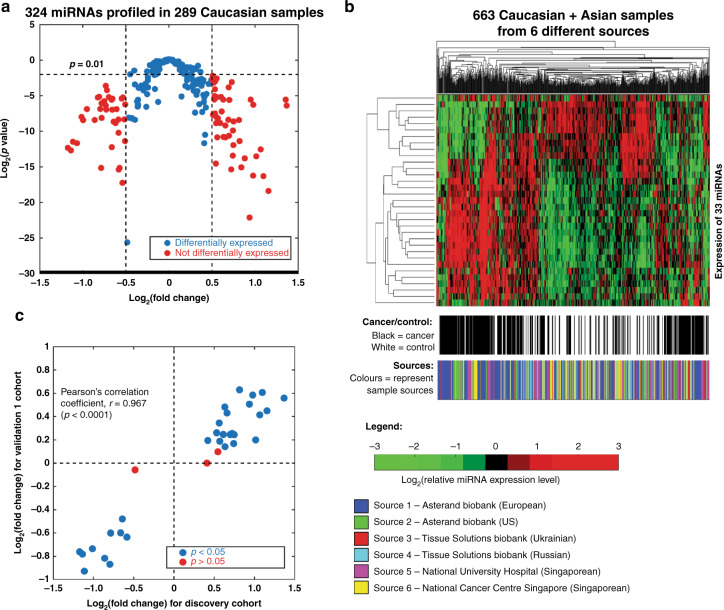
Fig. 1. Biomarker discovery.
a Volcano plot for 324 miRNAs profiled in 183 breast cancer patients as compared to 106 healthy individuals in the discovery cohort. Eighty-six miRNAs with p-values of less than 0.01 and magnitudes of log2 (fold change) of more than 0.5 are highlighted in red. b Heat-map of 663 cancer and non-cancer samples clustered using the expression of 33 selected miRNA biomarkers identified in the Discovery cohort. The expression levels (copy/ml) of miRNAs are presented in log2 scale and standardised to zero mean. The colour scale represents the concentrations of miRNA. Hierarchical clustering was carried out for both dimensions (miRNAs: Y-axis, samples: X-axis) based on the Euclidean distance. c Correlation of log2 (fold change) for 33 selected miRNA biomarker candidates in the Discovery cohort and Validation 1 cohort. The miRNA biomarker candidates with p-values larger than 0.05 in the validation 1 cohort are highlighted in red.

