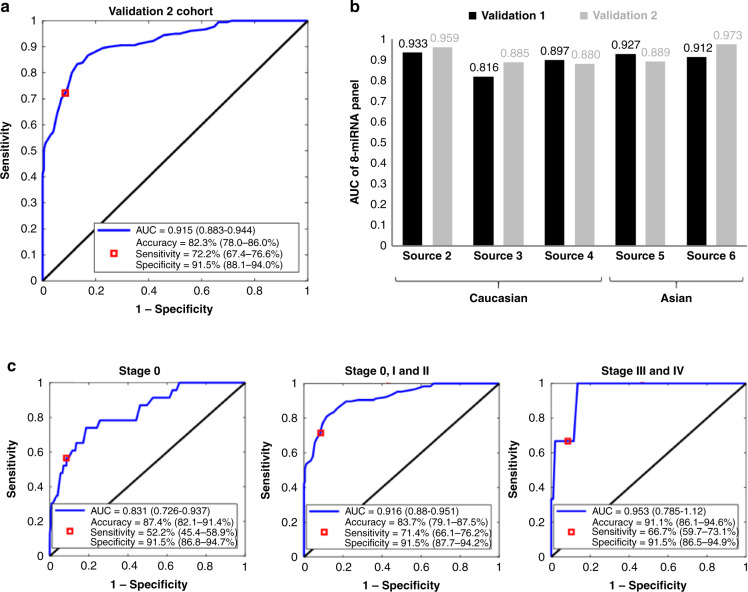
Fig. 3. Validation of optimal eight-miRNA biomarker panel.
a ROC curve for breast cancer prediction performance of the optimal eight-miRNA biomarker panel in the Validation 2 cohort. The point with the maximum classification accuracy is shown as the red box. The sensitivity and specificity values at the maximum accuracy point are also shown. The 95% CI for these values is shown in the brackets. b AUC of eight-miRNA biomarker panel in detecting breast cancer in the Validation 1 and Validation 2 cohorts separated by sample source. c ROC curves for performance of the optimal eight-miRNA biomarker panel in predicting early (stages 0, I and II) and late (stages III and IV) breast cancer in the Validation 2 cohort.

