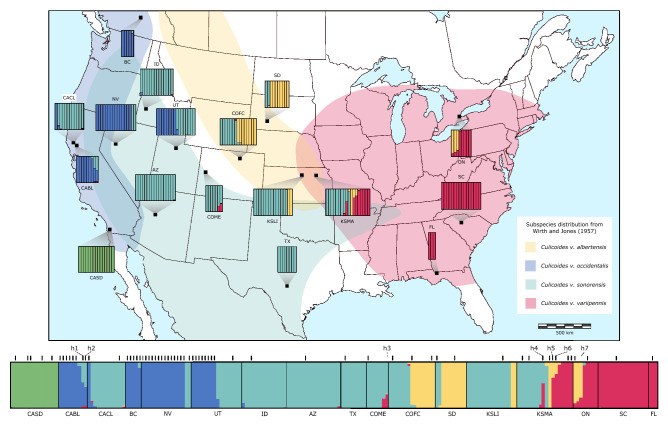
Figure 1.
Geographic distribution and structure plots for each collection site (black squares) overlaid on the historical distribution of the species described in Wirth and Jones 1957. The fastSTRUCTURE results are for 206 individuals inferred by 3612 SNPs and assuming five populations (K = 5). The vertical bars within each collection site represents an individual, with each color representing a cluster. The putative species identity of each cluster are as follows: Culicoides occidentalis (blue), C. sonorensis (teal), C. albertensis (yellow), C. variipennis (red), and an unidentified population in San Diego, CA (CASD) (green). The black bars above the overall structure plot indicates an individual for which the COI gene was also sequenced. The individuals inferred to be hybrids are labeled h1-7. This map was created using Inkscap v.1.1 (https://inkscape.org/).

