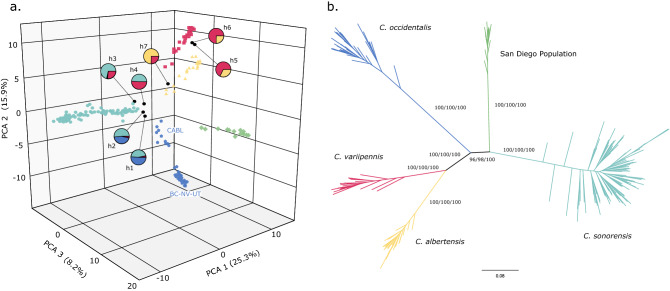
Figure 2.
(a) A 3D representation of the principal component analysis (PCA) of all individuals included in the study. Each color represents the cluster inferred from the structure analysis; C. albertensis (yellow), C. occidentalis (blue), C. sonorensis (teal), C. variipennis (red), and the unidentified San Diego population (green). Hybrids (h1–h7) are designated with a black circle and their inferred parental ancestry is depicted with pie charts. The geographic locations of the two C. occidentalis clusters are labeled next to each grouping (see Table 1 for abbreviation). (b) Unrooted maximum likelihood phylogenetic tree based on 199 individuals inferred from 3612 SNPs (the hybrids were removed here but are included in Fig. S3.). Clade colors also represent the clusters inferred from the structure analysis. Support values written on the branches: rapid bootstrap (%)/SH-aLRT support (%)/ultrafast bootstrap support (%). For clarity, the values within each cluster are not shown.

