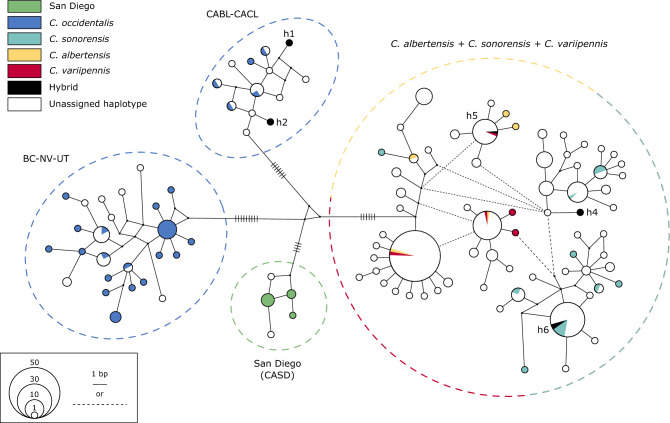
Figure 4.
A haplotype network inferred by a median-joining method, using 285 mitochondrial (mt) DNA sequences of the C. variipennis complex from 27 states in the U.S., as well as British Columbia and Ontario, Canada. The size of each circle represents the frequencies of the haplotype and the length of the lines connecting the circles corresponds to number of bp differences. Note that the dotted black lines also represent a single bp change. The 67 sequences obtained in the present study (see Fig. 1) are colored according the clusters assigned from the structure analysis. The four main groups of haplotypes (see Results) are circled.

