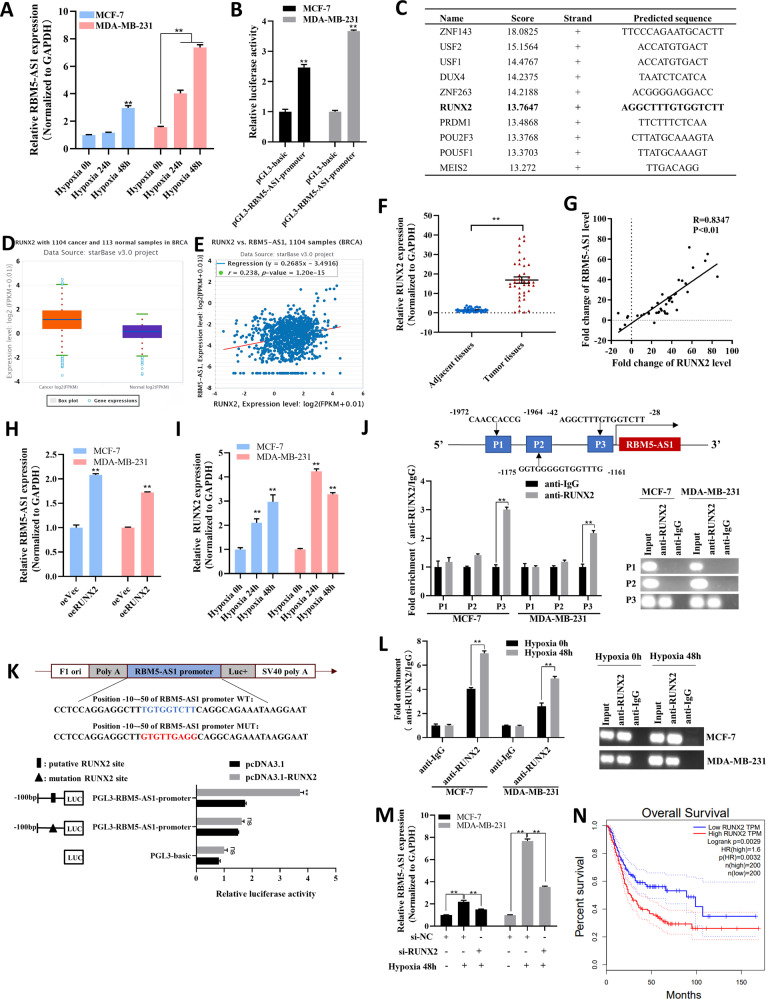
Fig. 2. Hypoxic-induced RUNX2 upregulates RBM5-AS1 expression in breast cancer cells.
A RBM5-AS1 levels in MCF-7 and MDA-MB-231 cells under hypoxic condition for 24 and 48 h. B Transcriptional activity of the RBM5-AS1 promoter region. The pGL3-RBM5-AS1-promoter were transfected into MCF-7 and MDA-MB-231 cells, then luciferase activity was checked. C Binding sequences of top-10 ranked transcription factors on RBM5-AS1 promoter predicted in JASPAR website. D RUNX2 levels in 1104 breast cancer tissues (left) and 113 normal breast tissues (right) from TCGA database extracted using StarBase 3.0. E Spearman correlation analysis of the RUNX2 mRNA and RBM5-AS1 levels in 1104 human breast cancer tissues from TCGA project extracted using StarBase 3.0. F RUNX2 levels in 40 paired breast cancer tissues and paracancerous normal tissues. G Spearman correlation analysis of the correlation between RUNX2 and RBM5-AS1 levels in 40 paired breast cancer tissues. (H) RBM5-AS1 levels in control or RUNX2-overexpressing MCF-7 and MDA-MB-231 cells. (I) RUNX2 levels in MCF-7 and MDA-MB-231 cells under hypoxic condition for 24 and 48 h. J Putative RUNX2 binding sites on the promoter region of RBM5-AS1 (upper). Enrichment of RUNX2 on RBM5-AS1 promoter in MCF-7 and MDA-MB-231 cells detected by ChIP assays (lower left) and PCR analysis (lower right). Approximately one −42 to −28 bp fragment of the RBM5-AS1 promoter is responsible for RUNX2 binding. K Mutagenesis of the putative RUNX2 binding site (−50 to −10 bp) on the RBM5-AS1 promoter abolished the transcriptional activation of RBM5-AS1 by RUNX2 in MCF-7 cells. L Enrichment of RUNX2 on RBM5-AS1 promoter region in MCF-7 and MDA-MB-231 cells under hypoxic condition for 48 h detected by ChIP-qPCR assays (left) and PCR analysis (right). M RBM5-AS1 levels in si-NC or si-RUNX2 transfected MCF-7 and MDA-MB-231 cells under hypoxic condition for 0 or 48 h. N The relationship between RUNX2 expression and OS of breast cancer patients from GEPIA website. All data are shown as the mean ± SEM. *P < 0.05 and **P < 0.01 by two-tailed Student’s t-test.

