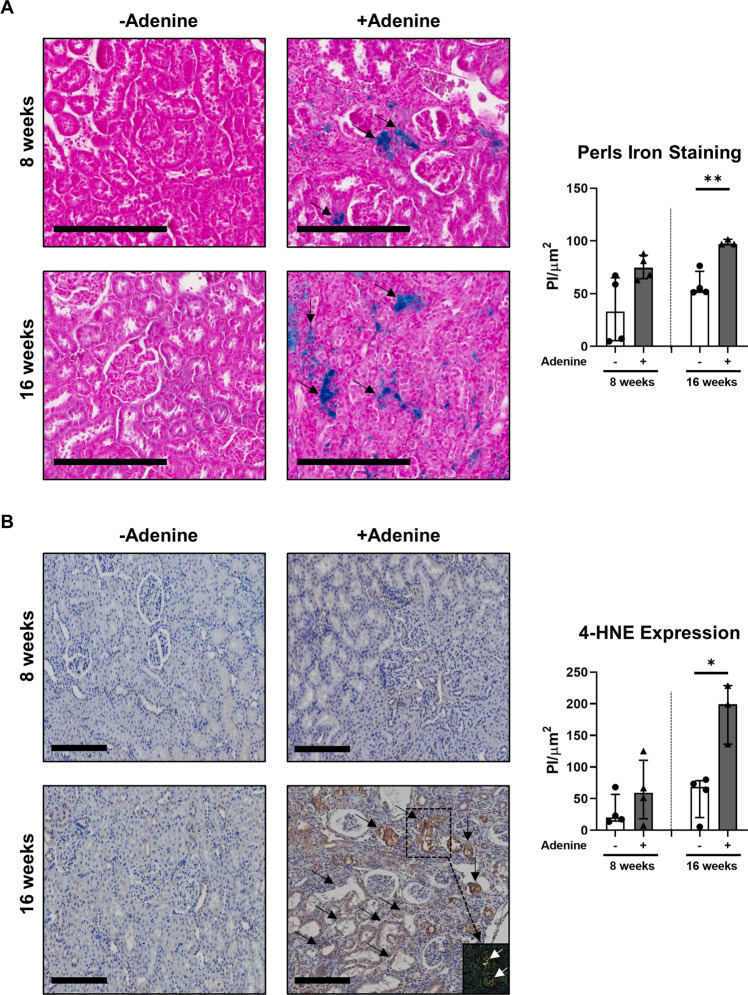
Fig. 1. Adenine overload leads to tubular crystal deposition and ferroptotic cell death in rats.
Wistar rats (n = 3–4/group) were fed powdered rat food alone (-adenine) or powdered food with 0.25% adenine (+adenine) for 8 and 16 weeks. A Left panel: Rat kidney sections were assessed for intracellular iron (Perls iron stain - blue) with neutral fast red counterstain (nuclei – red/cytoplasm – pink). Scale bars represent 200 μm. Tubular/peri-tubular positivity is highlighted with black arrows. Right panel: Quantitative analysis (pixel intensity (PI)/µm2 area) of Perls staining from three randomly selected areas for each tissue sample is presented. Bar graphs represent median values with interquartile range. *p < 0.05, Welch’s t-test. B Left panel: IHC labelling of rat kidney sections for lipid peroxidation end-product 4-HNE under light microscopy and with polarisation (inset for adenine-fed rat at 16 weeks) to visualise birefringent crystals (highlighted with white arrows). Scale bars represent 200 μm. Tubular 4-HNE positivity is highlighted with black arrows. Right panel: Quantitative analysis (PI/µm2 area) of IHC staining from eight randomly selected areas for each tissue sample is presented. Bar graphs represent median values with interquartile range. *p < 0.05, Welch’s t-test.

