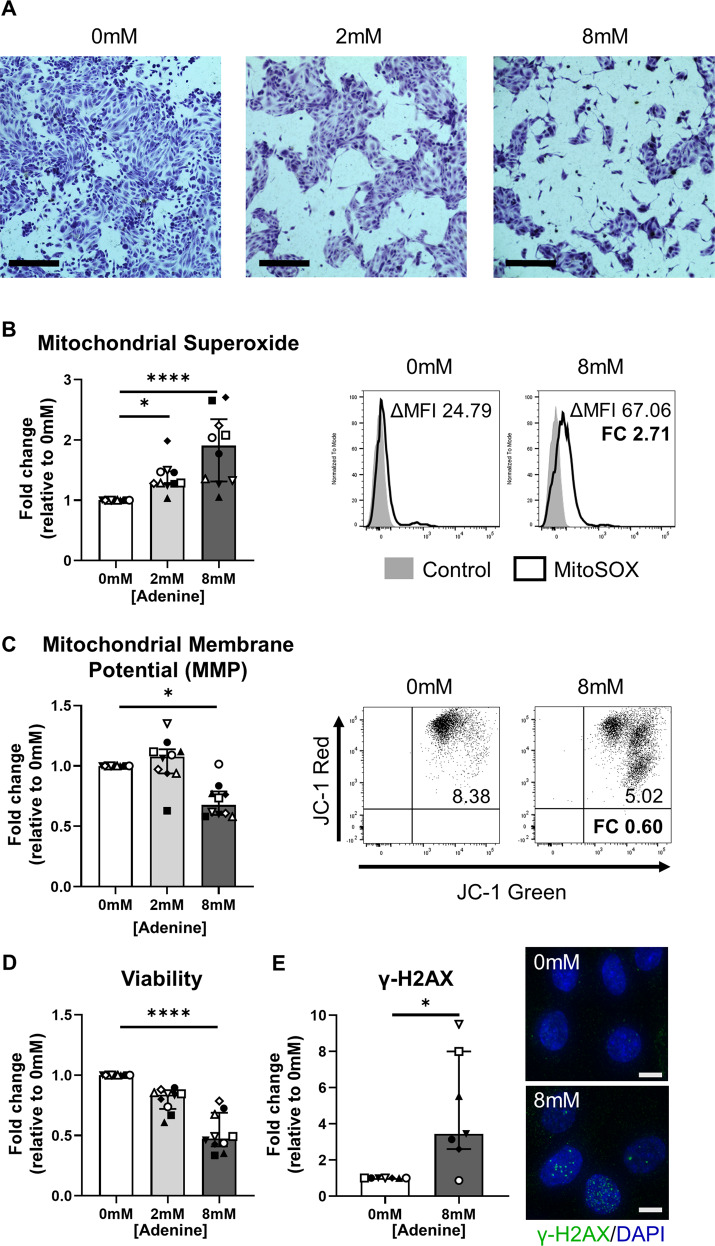
Fig. 2. Adenine overload induces pathways of mitochondrial oxidative damage/dysfunction and DNA damage in human primary PTEC.
A Light microscopy images of PTEC cultured for 48 h in the absence (0 mM) or presence of low-dose (2 mM) and high-dose (8 mM) adenine. Morphology was assessed by toluidine blue staining. PTEC were fixed in 10% buffered formalin solution for 5 min, then stained with 1% toluidine blue solution for 20 min. Scale bars represent 200 μm. One representative of two PTEC donor experiments. B Left panel: Fold changes (relative to 0 mM adenine) in mitochondrial superoxide levels [measured as delta median fluorescence intensity (ΔMFI; MFI test – MFI unstained control)] for PTEC cultured in the absence (0 mM) or presence of low-dose (2 mM) and high-dose (8 mM) adenine. Bar graphs represent median values with interquartile range. Symbols represent individual donor PTEC; n = 10. *p < 0.05, ****p < 0.0001, Friedman test with Dunn’s post-test. Right panel: Representative MitoSOX staining (black unfilled) compared with unstained control (grey filled) for PTEC cultured in the absence (0 mM) and presence (8 mM) of adenine. Mitochondrial superoxide levels (ΔMFI) are presented for each histogram, with fold change (FC) value relative to 0 mM adenine also shown. C Left panel: Fold changes (relative to 0 mM adenine) in mitochondrial membrane potential (MMP) [measured as the ratio of ΔMFI JC-1 red/ΔMFI JC-1 green] for PTEC cultured in the absence (0 mM) or presence of low-dose (2 mM) and high-dose (8 mM) adenine. Bar graphs represent median values with interquartile range. Symbols represent individual donor PTEC; n = 10. *p < 0.05, Friedman test with Dunn’s post-test. Right panel: Representative JC-1 dot plots of PTEC cultured in the absence (0 mM) and presence (8 mM) of adenine. MMP values are presented for each histogram, with fold change (FC) value relative to 0 mM adenine also shown. D Fold changes (relative to 0 mM adenine) in cell viability (MTT assay) for PTEC cultured in the absence (0 mM) or presence of low-dose (2 mM) and high-dose (8 mM) adenine. Bar graphs represent median values with interquartile range. Symbols represent individual donor PTEC; n = 10. ****p < 0.0001, Friedman test with Dunn’s post-test. E Left panel: Fold changes (relative to 0 mM adenine) in γ-H2AX protein expression (measured as % cells with >5 γ-H2AX foci) for PTEC cultured in the absence (0 mM) and presence (8 mM) of adenine. Bar graphs represent median values with interquartile range. Symbols represent individual donor PTEC; n = 7. *p < 0.05, Wilcoxon matched-pairs signed-rank test. Right panel: Immunofluorescent labelling of representative PTEC cultured in the absence (0 mM) and presence (8 mM) of adenine and stained for γ-H2AX (green) and DAPI (blue). Scale bars represent 20 μm.

