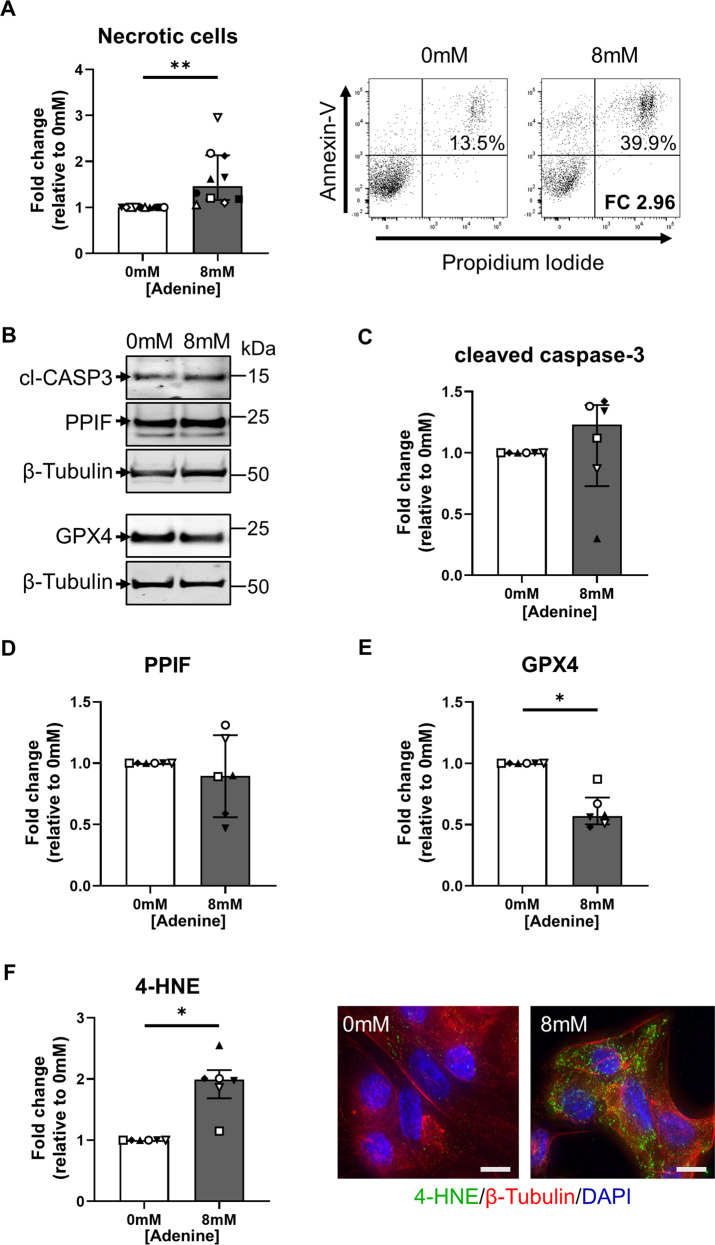
Fig. 3. Adenine overload selectively induces ferroptosis in human primary PTEC.
A Left panel: Fold changes (relative to 0 mM adenine) in cellular necrosis (% Annexin-V+ PI+ cells) for PTEC cultured in the absence (0 mM) and presence (8 mM) of adenine. Bar graphs represent median values with interquartile range. Symbols represent individual donor PTEC; n = 10. **p < 0.01, Wilcoxon matched-pairs signed-rank test. Right panel: Representative donor Annexin-V/PI dot plots of PTEC cultured in the absence (0 mM) and presence (8 mM) of adenine. The percentage of Annexin-V+ PI+ necrotic cells for each dot plot are presented, with fold change (FC) value relative to 0 mM adenine also shown. B Western blot for cleaved caspase-3 (cl-CASP3), PPIF and GPX4 for PTEC cultured in the absence (0 mM) and presence (8 mM) of adenine (15 µg total protein per lane). Representative images from one of six donor PTEC are presented. C–E Fold changes (relative to 0 mM adenine) in cleaved caspase 3 (C), PPIF (D) and GPX4 (E) protein levels (as a ratio of loading control β-tubulin) for PTEC cultured in the absence (0 mM) and presence (8 mM) of adenine. Bar graphs represent median values with interquartile range. Symbols represent individual donor PTEC; n = 6. *p < 0.05, Wilcoxon matched-pairs signed-rank test. F Left panel: Fold changes (relative to 0 mM adenine) in 4-HNE expression (measured as mean CTCF of >50 cells per condition) for PTEC cultured in the absence (0 mM) and presence (8 mM) of adenine. Bar graphs represent median values with interquartile range. Symbols represent individual donor PTEC; n = 6. *p < 0.05, Wilcoxon matched-pairs signed-rank test. Right panel: Immunofluorescent labelling of representative PTEC cultured in the absence (0 mM) and presence (8 mM) of adenine and stained for 4-HNE (green), β-tubulin (red) and DAPI (blue). Scale bars represent 20 μm.

