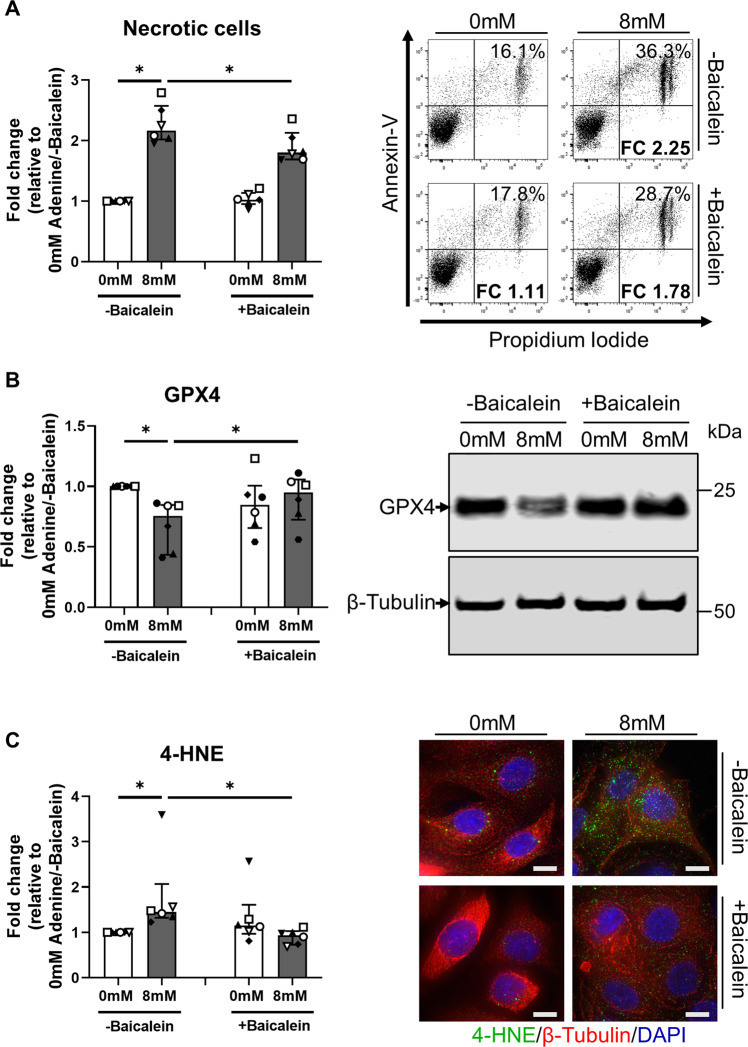
Fig. 4. Baicalein attenuates adenine-induced ferroptotic cell death in human primary PTEC.
A Left panel: Fold changes (relative to 0 mM adenine without baicalein treatment) in cellular necrosis (% Annexin-V+ PI+ cells) for PTEC cultured in the absence (0 mM) and presence (8 mM) of adenine, both without (-baicalein) and with (+baicalein) treatment. Bar graphs represent median values with interquartile range. Symbols represent individual donor PTEC; n = 6. *p < 0.05, Wilcoxon matched-pairs signed-rank test. Right panel: Representative donor Annexin-V/PI dot plots of PTEC cultured in the absence (0 mM) and presence (8 mM) of adenine, both without (-baicalein) and with (+baicalein) treatment. The percentage of Annexin-V+ PI+ necrotic cells for each dot plot are presented, with fold change (FC) values relative to 0 mM adenine without baicalein treatment also shown. B Left panel: Fold changes (relative to 0 mM adenine without baicalein treatment) in GPX4 expression for PTEC cultured in the absence (0 mM) and presence (8 mM) of adenine, both without (-baicalein) and with (+baicalein) treatment. Bar graphs represent median values with interquartile range. Symbols represent individual donor PTEC; n = 6. *p < 0.05, Wilcoxon matched-pairs signed-rank test. Right panel: Representative GPX4 Western blot for PTEC cultured in the absence (0 mM) and presence (8 mM) of adenine, both without (-baicalein) and with (+baicalein) treatment (15 µg total protein per lane). C Left panel: Fold changes (relative to 0 mM adenine without baicalein treatment) in 4-HNE expression (measured as mean CTCF of >50 cells per condition) for PTEC cultured in the absence (0 mM) and presence (8 mM) of adenine, both without (-baicalein) and with (+baicalein) treatment. Bar graphs represent median values with interquartile range. Symbols represent individual donor PTEC; n = 6. *p < 0.05, Wilcoxon matched-pairs signed-rank test. Right panel: Immunofluorescent microscopy of representative PTEC cultured in the absence (0 mM) and presence (8 mM) of adenine, both without (-baicalein) and with (+baicalein) treatment, and stained for 4-HNE (green), β-tubulin (red) and DAPI (blue). Scale bars represent 20 μm.

