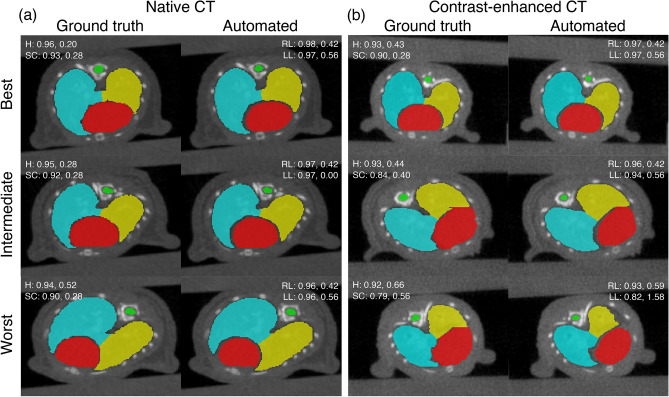
Figure 4.
Examples of the best (first row), intermediate (second row), and worst (third row) segmentation results for the (a) native CT and (b) contrast-enhanced CT datasets obtained by the nnU-Net 3d_fullres model compared to the ground truth. The DSC scores (first value) and 95p HD in mm (second value) for each organ are also given. H, SC, RL and LL correspond to the heart (red), spinal cord (green), right lung (blue) and left lung (yellow), respectively.

