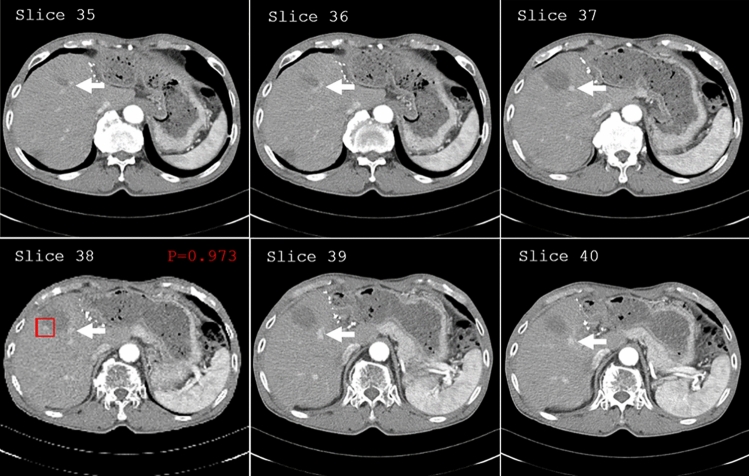
Figure 2.
Prediction map for true positive predicted LTP region. In the prediction map, we report the rectangular region of interest on the axial slice of the whole CT scan, slide number, tumor prediction probability, as well as neighboring image slices included in the positive-predicted regions. LTP was detected (red rectangular), and hepatic vessels including hepatic artery and portal vein (arrows) were not indicated in the prediction map.

