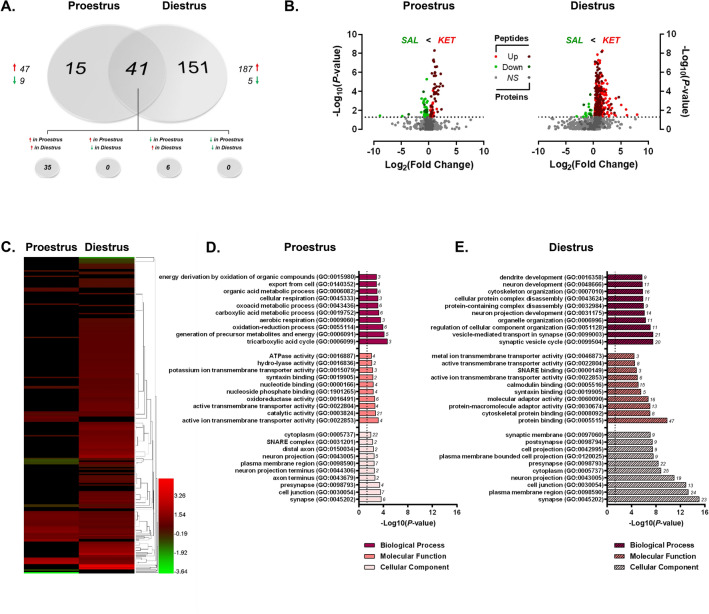
Figure 10.
Ketamine-induced changes in the dHPC phosphoproteome of proestrus and diestrus female rats. (A) Venn diagram depicting the number of phosphoproteins with significant estrous cycle-dependent differential abundance between ketamine (KET)- and saline (SAL)-treated proestrus or diestrus female rats. Red arrows indicate greater levels observed in KET- vs. SAL-treated rats. (B) Volcano plots showing significant KET-induced alterations in dHPC phosphoprotein abundance in proestrus (left) and diestrus (right) female rats. Log2(Fold Change) values > 0 (red) indicate higher—and those < 0 (green) lower—abundance in KET-treated rats compared to SAL groups. Points above the horizontal dashed line represent proteins with p < 0.05 (FDR threshold set at 1%). (C) Heat map illustrating fold change of phosphoproteins significantly affected by KET in either proestrus or diestrus female rats. Top 10 most significant (p < 0.05) gene ontology (GO) enrichment terms per category of phosphoproteins with significant KET-induced differential abundance in proestrus (D) and diestrus (E) female rats. Heat map (C) was produced in GENE-E (Broad Institute; https://software.broadinstitute.org/GENE-E/).

