Figure 3.
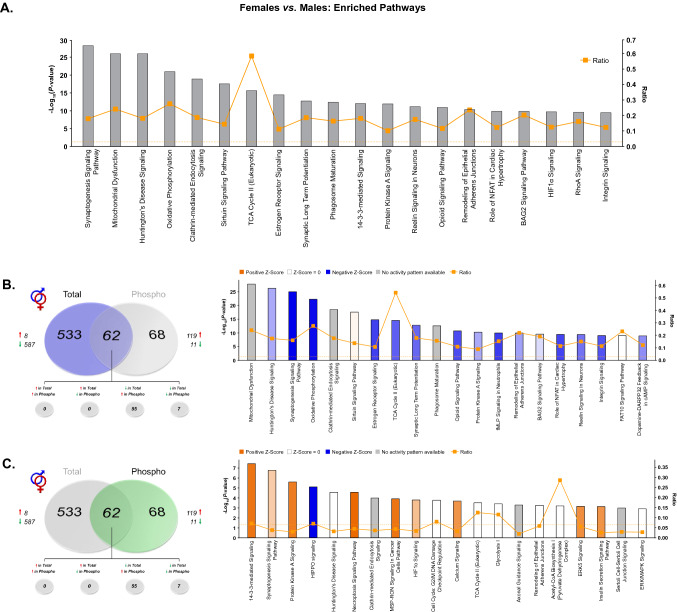
IPA enrichment analyses of differentially-abundant proteins and phosphoproteins between female and male rats. (A) Canonical pathway enrichment for combined list of proteins and phosphoproteins significantly differentially abundant between female and male rats. Separate IPA analyses of total (B) and phosphoproteins (C) with sex-dependent abundance describe contributions of each fraction to predicted activity levels within enriched pathways. Based upon the direction of fold change of significant differentially abundant proteins/phosphoproteins within the dataset, the Z-Score serves as a predictor of pathway activation states by assessing the match between the observed and predicted (evidence-based) up/down regulation patterns (see41). Pathways are colored by predicted activation state: orange (activated) or blue (inhibited), where darker colors represent higher absolute Z-scores. Z-scores for pathways colored in gray could not be calculated due to insufficient evidence for a prediction of either activation or inhibition to be made. The ratio (solid orange line) represents the number of molecules within the comparison dataset meeting the cutoff criterion (p < 0.05; Fisher’s Exact Test), divided by the number of molecules comprising a given pathway within the reference set (Ingenuity Knowledge Base). Bar graphs were produced in Ingenuity Pathway Analysis (IPA) software (QIAGEN, Inc.).

