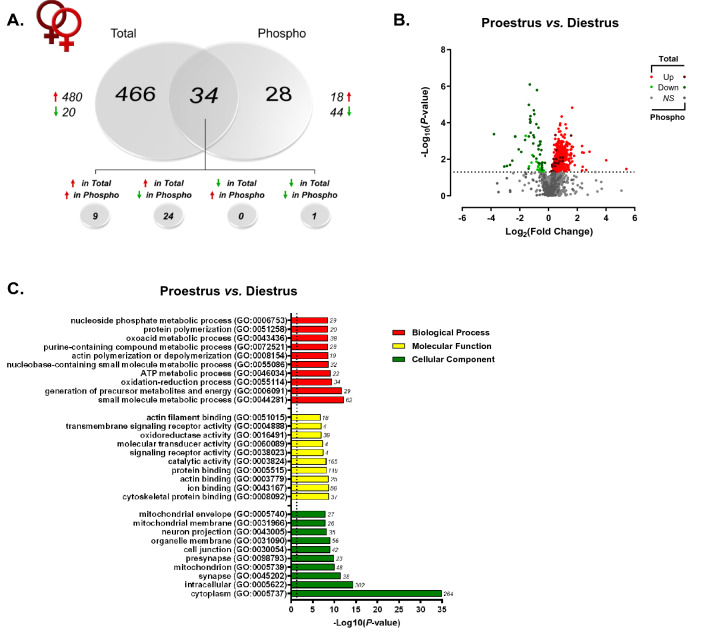
Figure 4.
Estrous cycle-dependent total and phosphoprotein expression in the dHPC. (A) Venn diagram showing number of total (“Total”) and phosphoproteins (“Phospho”) with significant differential abundance between female rats in either proestrus or diestrus. Red arrows indicate greater levels observed in proestrus vs. diestrus females. (B) Volcano plot depicting significant differences in protein and phosphoprotein abundance between proestrus and diestrus female rats. Log2(Fold Change) values > 0 (red) indicate higher, and those < 0 (green) lower, abundance in proestrus females compared to diestrus females. Dots above the horizontal dashed line represent proteins with p < 0.05 (FDR threshold set at 1%). (C) Top 10 most significant (p < 0.05) gene ontology (GO) enrichment terms per category of proteins and phosphoproteins with significant estrous cycle-dependent abundance differences.

