Figure 7.
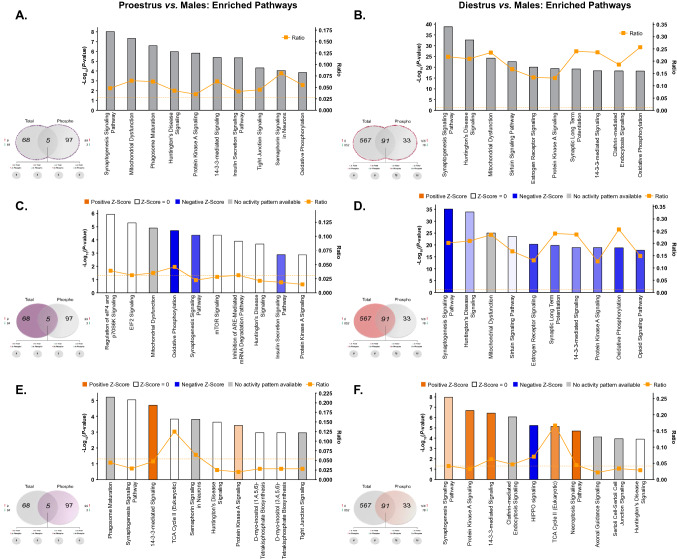
IPA enrichment analyses of estrous cycle-specific differences in protein and phosphoprotein abundance between female and male rats. (A,B) Canonical pathway enrichment for combined list of proteins and phosphoproteins identified as differentially abundant (p < 0.05) from proestrus vs. males (A) and diestrus vs. males comparisons. Separate IPA analyses of total proteins (C,D) and phosphoproteins (E,F) with estrous cycle-specific sex differences in abundance describe contributions of each fraction to predicted activity levels within enriched pathways. Based upon the direction of fold change of significant differentially abundant proteins/phosphoproteins within the dataset, the Z-Score serves as a predictor of pathway activation states by assessing the match between the observed and predicted (evidence-based) up/down regulation patterns41. Pathways are colored by predicted activation state: orange (activated) or blue (inhibited), where darker colors represent higher absolute Z-scores. Z-scores for pathways colored in gray could not be calculated due to insufficient evidence for a prediction of either activation or inhibition to be made. The ratio (solid orange line) represents the number of molecules within the comparison dataset meeting the cutoff criterion (p < 0.05; Fisher’s Exact Test), divided by the number of molecules comprising a given pathway within the reference set (Ingenuity Knowledge Base). Bar graphs were produced in Ingenuity Pathway Analysis (IPA) software (QIAGEN, Inc.).

