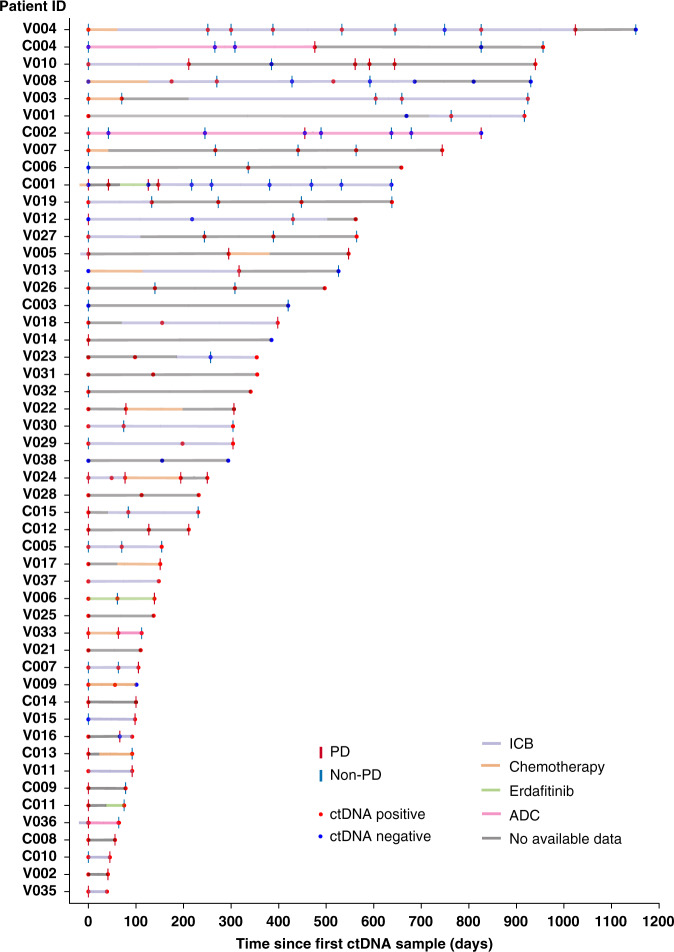
Fig. 1. Swimmer plot showing the disease course in each patient, treatment, ctDNA status, and radiographic response.
Red dots represent positive ctDNA samples, blue dots represent a negative ctDNA samples, vertical red lines represent PD, and vertical blue lines represent non-PD. ICB: immune checkpoint blockade, ADC: antibody–drug conjugates.

