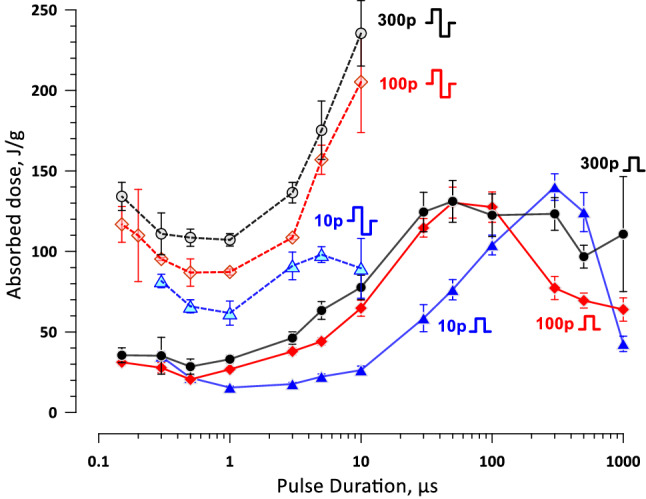
Figure 11.

The absorbed dose, J/g, at the threshold for cell killing by uni- and bipolar pulses of different duration (solid and dashed lines, respectively). For bipolar pulses, the dose is plotted against the duration of one phase. The pulse shape and the number of pulses per train are labeled next to the respective curves (“10p”, “100p”, and “300p” stand for 10, 100, and 300 pulses per train respectively). Pulse repetition rate was 10 Hz. See text and Figs. 6 and 7 for more details.
