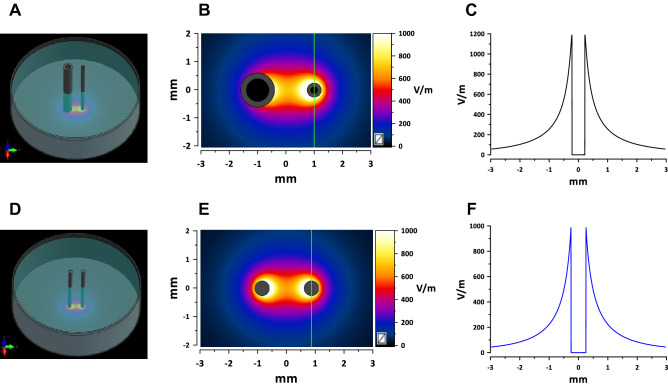
Figure 2.
Electric field simulations for the asymmetrical (A–C) and symmetrical (D–F) electrode assemblies. (A) and (D) show the spatial configuration of the electrode assemblies orthogonal to a plastic dish and touching its bottom. (B) and (E) show the calculated electric field distribution in a plane 5 µm above the bottom with 1 V applied between electrodes. The direction in which the electric field thresholds were measured is marked by vertical green lines (see text). (C) and (F) are the electric field values along the green lines. These values were linearly scaled to the voltage applied between the electrodes for calculation of the electric field thresholds.

