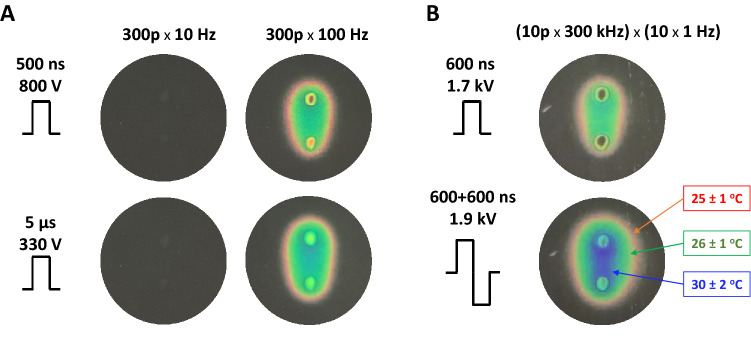
Figure 4.
Monitoring the temperature rise due to PEF exposure with thermochromic liquid crystal sheets. Images were taken by the end of exposure to a train of 300 pulses at 10 or 100 Hz (A) or to a series of 10 bursts at 1 Hz (B). Each burst consisted of 10 uni- or bipolar pulses at 300 kHz. Other exposure parameters are marked in the legends. Temperatures at the color transitions are labeled in panel B according to the manufacturer’s specifications.

