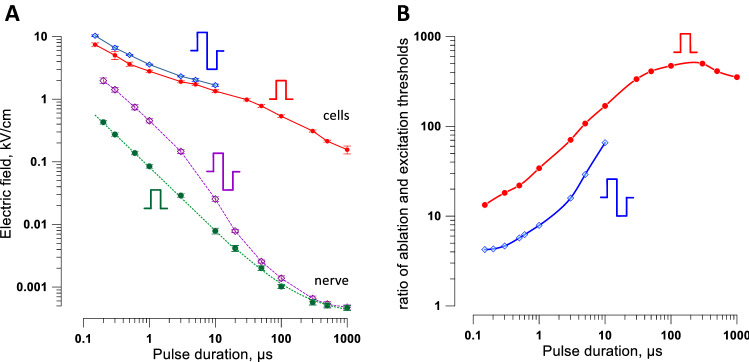
Figure 9.
A comparison of the electric field thresholds for cell killing and for peripheral nerve stimulation. (A) Strength-duration curves for cell killing (solid lines) and for nerve excitation (dashed lines). Cell killing data are for trains of 300 uni- or bipolar pulses at 10 Hz (same data as in Figs. 6 and 7). Nerve stimulation data are for a single uni- or bipolar pulse as measured in isolated sciatic nerves in a conductive medium (from Fig. 2C in Ref. 43). Error bars may be smaller than the central symbol. (B) Ratios of the cell killing and nerve stimulation thresholds plotted against pulse duration (for bipolar pulses, against one phase duration).

