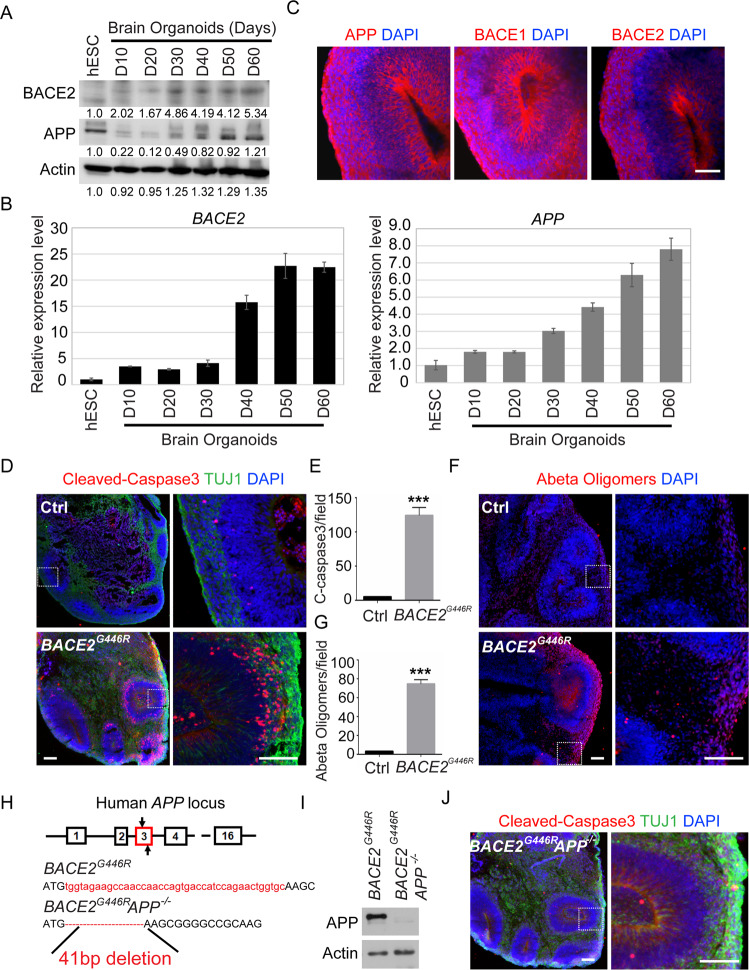
Fig. 3. BOs with BACE2 loss-of-function mutation exhibit AD-like phenotypes.
A Western blot analyses of total proteins from hPSC-derived BOs from day 0-60 using the indicated antibodies. B qRT-PCR analysis of the mRNA levels of APP and BACE2 in hPSC-derived BOs from day 10 to 60. The quantification data are shown as the mean ± S.D (n = 3). C Confocal images showed the expression and distribution of BACE1, BACE2 and APP in hPSC-derived BOs on day 40. Scale bar: 100 μm. D, E Representative images and quantitation of cellular apoptosis evaluated by immunostaining of Cleaved-caspase3, the quantitation data were from 3 BOs per cell line. Scale bar: 100 μm. F, G Representative images and quantitation of Aβ accumulation evaluated by immunostaining of Aβ oligomers, the quantitation data were from 3 BOs per line. Scale bar: 100 μm. H–I. Schematic of CRIPSR targeting exon 3 of APP gene to generate BACE2G446R/APP-/- iPSC line from BACE2G446R parental line. A pair of gRNAs targeting and putative cut sites of Cas9D10A are indicated. BACE2G446R/APP−/− carries a 41 bp deletions in both alleles are confirmed by sanger sequencing and western blotting analysis. J Representative images showed the cellular apoptosis by immunostaining of Cleaved-caspase3 in BACE2G446R and BACE2G446R/APP-/- hPSC-derived BOs. Scale bar: 100 μm.

