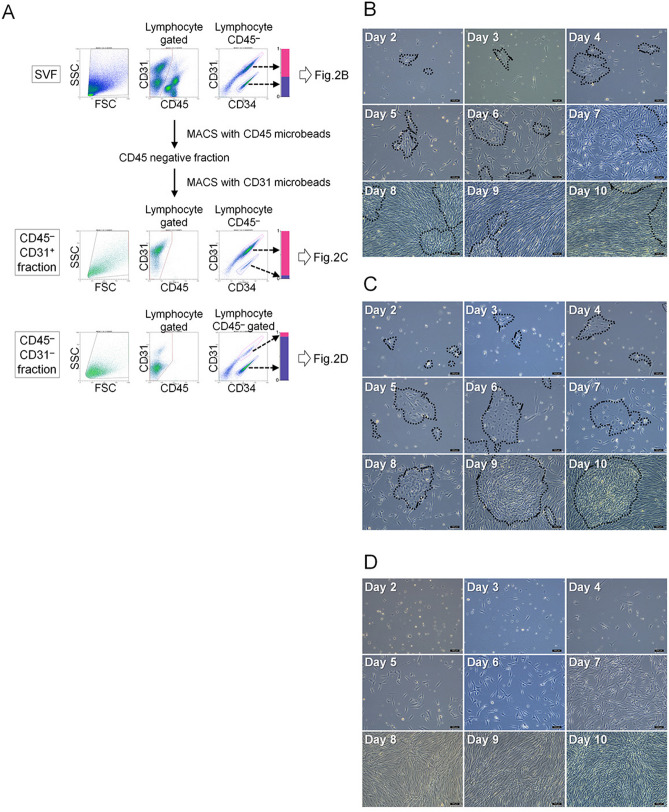
Figure 2.
MACS separation and culture of the SVF. (A) The freshly isolated, hemolyzed SVF was separated into CD45−CD31+ (AEPC-rich) and CD45−CD31− fractions (ASC-rich) in the first MACS separation. During this flow cytometric analysis, lymphocyte gating events in the SSC versus SFC plot were set to 100%. CD45−CD34+CD31+ (magenta ROI) was defined as the AEPC population. CD45−CD34+CD31− (violet ROI) was defined as the ASC population. Bar charts display the ratio between the CD45−CD31+CD34+ and CD45−CD31+CD34− populations in the SVF (upper panels), CD45−CD31+, (middle panels), and CD45−CD31− fractions (lower panels), which were 0.54 to 0.46 ± 0.075 (n = 9, 9 donors, mean ± SD), 0.95 to 0.05 ± 0.03 (n = 5, 5 donors, mean ± SD), and 0.18 to 0.82 ± 0.08 (n = 5, 5 donors, mean ± SD), respectively. Cultivation of the (B) freshly isolated SVF, (C) first MACS-separated CD45−CD31+ fraction (AEPC-rich), and (D) first MACS-separated CD45−CD31− fraction (ASC-rich). The morphologies of all the populations were photographed daily from days 2–10 using a phase-contrast microscope (Leica DM IL LED with a camera MC170HD; 100× magnification). Bars represent 100 µm. All the cell populations were seeded at 1 × 10⁴ nucleated cells/0.2 mL of EGM-2 media/cm2. Dotted circles indicate AEPC colonies. The experiment was performed twice, independently from 2 donors.

