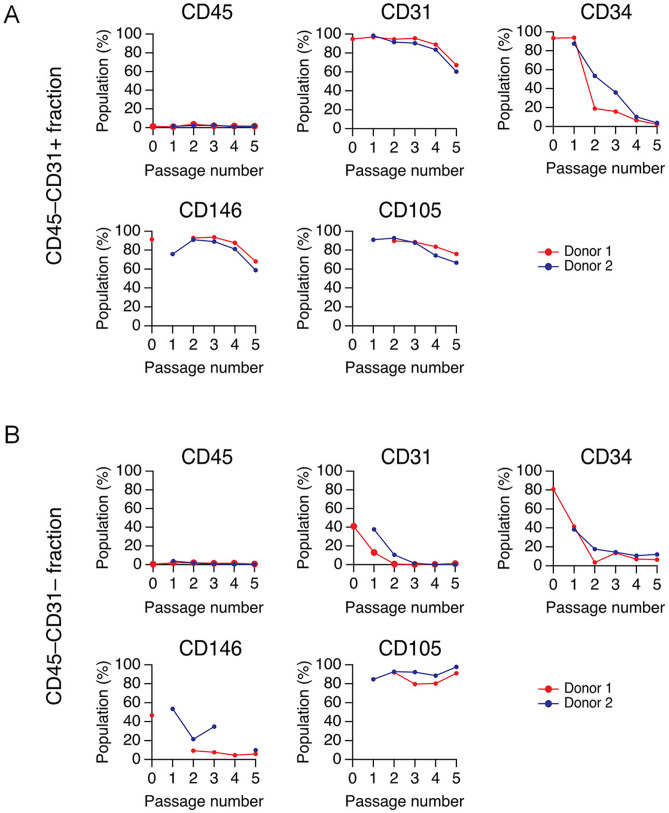
Figure 4.
Time-dependent changes in AEPC cell morphologies and surface marker expression profiles. (A) The CD45−CD31+ and (B) CD45−CD31− MACS-separated fractions were characterized for the expression of CD markers, including CD45, CD31, CD34, CD146, and CD105. The experiment was performed twice, independently from 2 donors. The graph indicates 2 donors, depicted by red and blue lines. The X-axis (passage number) indicates that the CD45−CD31+ fraction at P5 corresponded to dissociated AEPCs at P4D4, as shown in Fig. 3D.

