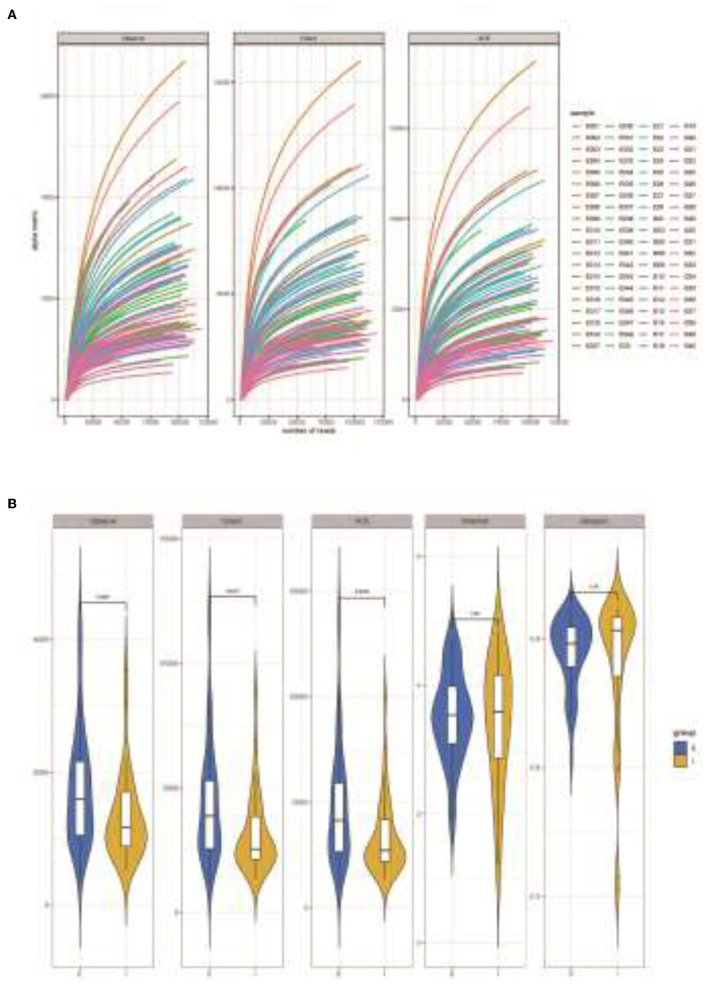
Figure 1.
Analysis of microbial diversity in sputum samples of COPD frequent exacerbators and infrequent exacerbators. (A), 16S sequencing dilution curve results. (B), QIIME software was used to calculate the Alpha diversity index of both sample groups. E represented COPD frequent exacerbators; I represented COPD infrequent exacerbators. COPD, chronic obstructive pulmonary disease.

