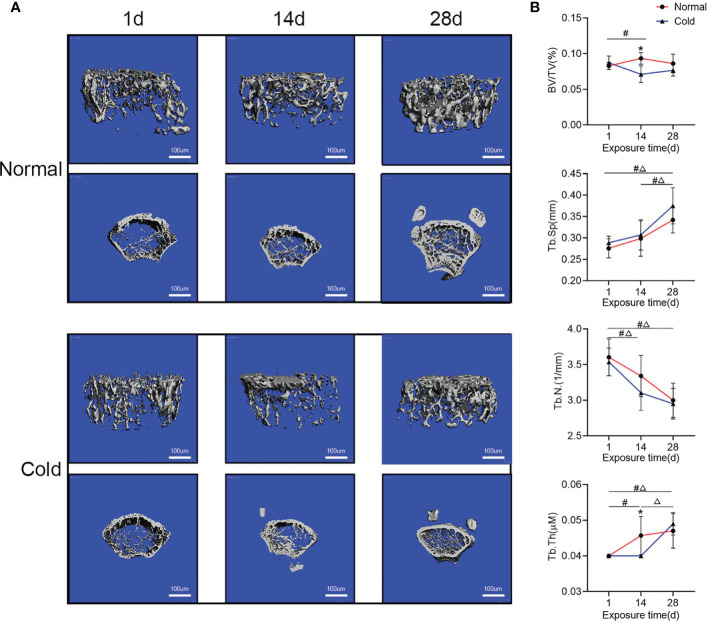
Figure 1.
Bone mass fluctuates with increased time. (A) Representative images of micro-CT are shown. (B) Trabecular bone microarchitecture of tibias showing bone volume/total volume (BV/TV), trabecular number (Tb.N), trabecular separation (Tb.Sp), and trabecular thickness (Tb.Th). Data are shown as the mean ± SD (n=5 per group). Significance (p-value) was calculated using two-way ANOVA, *p < 0.05, cold group vs. normal group; #p < 0.05, difference at different time points in the normal group; Δp < 0.05, difference at different time points in the cold group; 1 day (1 d), 14 days (14 d), 28 days (28 d), Normal: mice at room temperature (23°C), Cold: mice at 4°C.

