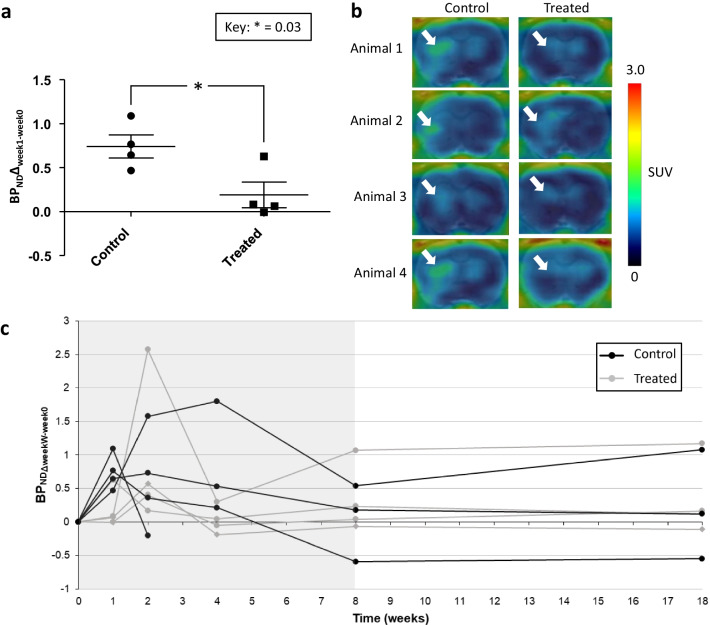
Fig. 3.
Results from in vivo PET imaging. a Results from week 1 indicated a treatment effect of dimethyl fumarate (DMF). The binding potential (BPNDΔweek1-week0) was calculated by reducing the BPND of week 1 from the baseline image of an individual using a constant VOI for each animal for each time point. Statistics were calculated using the Student’s t-test. The results are presented as mean (SD). Values in this figure represent the changes compared to baseline and not the original values to aid comparability of the BPND between different individuals. However, the original values were applied in the statistical analyses. b Representative week 1 images. c Longitudinal in vivo imaging showed no differences between the control and DMF-treated animals at any time point when analysed using a linear mixed model. Binding potential was calculated by first calculating: (BPND) (ipsilateral uptake − contralateral uptake)/ contralateral uptake. After this, BPNDΔweekW-week0 was calculated by reducing the BPND of the specific week (W = 1/2/4/8/18) from the baseline image of an individual using a constant VOI for each animal through the different time points. The treatment period for Set A animals is indicated as grey background in the graph

