Fig. 4.
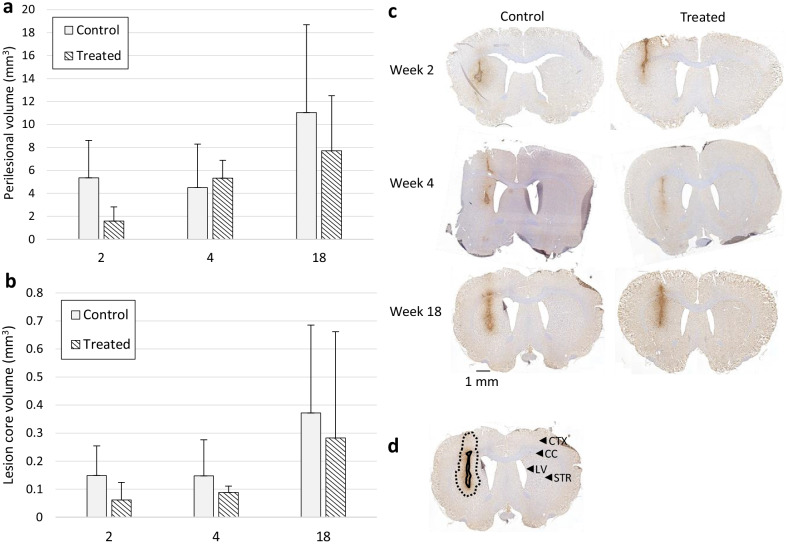
Immunohistochemical staining against Iba1 in weeks 2, 4, and 18. Nuclei are counterstained with haematoxylin. a, b The volume was determined semi-quantitatively by calculating the area of activated microglia at 100-µm intervals and extrapolating the area in between using the trapezoidal rule. a The perilesional volume (mm3) of the lesion and b the lesion core volume were calculated as an average for both the control and treated animals. No differences were detected at any time points between the treated and control animals. The results are presented as mean (SD). c Representative images of the control and treated animals in weeks 2, 4, and 18. Scale bar = 1 mm. d A representative image of the lesion core (solid black line) and perilesional area (dotted black line) delineation of the week 18 control animal. The lesion core indicates the infiltrative core area of the lesion with high Iba1 staining. The perilesional area is a subjective estimate of the area that has increased diffuse microglial activation higher from the contralateral staining but less prominent as the lesion core. In addition, the prominent brain regions visible on the coronal sections have been indicated on the contralateral side by using arrow-heads. CTX cortex, LV lateral ventricle, CC corpus callosum, STR striatum

