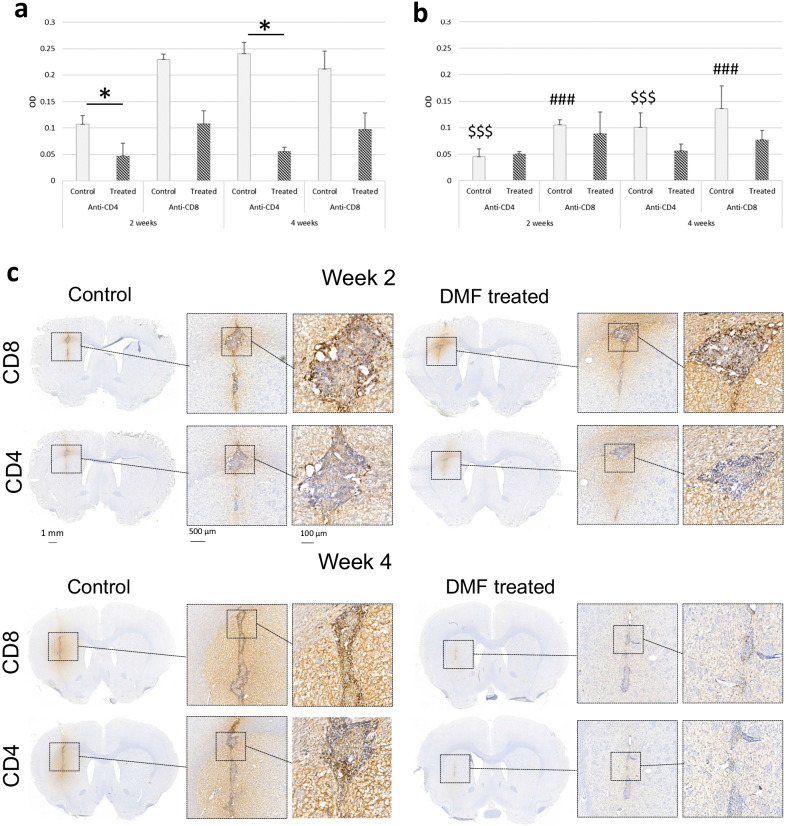
Fig. 5.
Immunohistochemical staining of T lymphocytes. Staining was performed against CD4 and CD8 for control and DMF-treated animals in Set B (n = 8) and Set C (n = 8) 2 and 4 weeks after treatment with vehicle or DMF. Optical density (OD) was calculated by subtracting the contralateral ODROI from the lesion/perilesional ODROI. a The OD of CD4+ and CD8+ T lymphocytes at the lesion core. The asterisk (*) denotes significant differences between DMF-treated and control animals. b The corresponding OD in the perilesional area. In both the anti-CD4 and anti-CD8 staining, the control group had significantly higher OD values at the lesion core (a) than in the perilesional area (b) (p < 0.001). These differences were not found in the treated group (anti-CD4: p = 1; anti-CD8 p = 0.2) in post hoc analysis. Controls had significantly higher CD4+ OD values at the lesion core (a) compared to the DMF-treated group (p = 0.041), but this was not detected with CD8. The dollar sign ($) indicates significant differences between the CD4+ OD of the control animals at the focal lesion core (a) compared to the perilesional area (b) (p < 0.001). The number sign (#) indicates significant differences between the CD8+ OD of the control animals at the lesion core (a) compared to the perilesional area (b) (p < 0.001). The results are presented as mean (SD). c Representative immunohistochemical staining against CD4+ and CD8+ T lymphocytes in the lesion core in the control and DMF-treated animals. Nuclei are counterstained with haematoxylin. Scale bar = 500 µm, or 100 µm in the enlarged image

