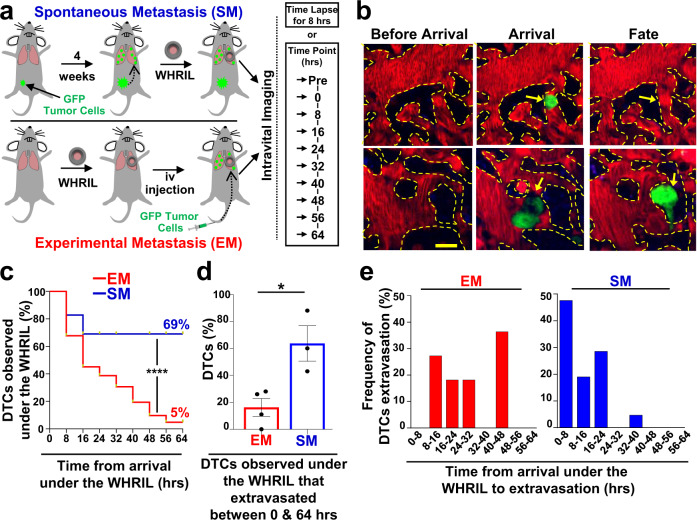
Fig. 1. Tumor cells that spontaneously disseminate from the primary tumor to the lung have a drastically increased metastatic efficiency compared to intravenously injected tumor cells.
a Experimental design to track the fate of individual disseminated tumor cells using an Experimental Metastasis (EM) model (top) and a Spontaneous Metastasis (SM) model (bottom). b Serial imaging through the WHRIL allows tracking of the fate of disseminated tumor cells. Vasculature before arrival (left), upon arrival (middle) and after arrival of tumor cells (TCs). Fate of TCs (yellow arrows) could be either recirculation or apoptosis (right, top) or extravasation into the lung parenchyma (right, bottom). Red = tdTomato labeled endothelial cells and 155 kDa Tetramethylrhodamine dextran labeled blood serum, Green = GFP labeled tumor cells, Blue = second harmonic generation. Scale bar = 15 μm. c Kaplan-Meier survival curves showing the percentage of E0771-GFP tumor cells observed under the WHRIL at each 8 hr time point over a period of 64 hrs. EM: n = 62 tumor cells analyzed in 3 mice. SM: n = 29 tumor cells analyzed in 3 mice. Log-rank (Mantel-Cox) test (p < 0.0001). ****p < 0.0001. d Percentage of E0771-GFP EM and SM tumor cells observed under the WHRIL that extravasated between 0 and 64 hrs after arrival. EM: n = 89 tumor cells in 4 mice. SM: n = 29 tumor cells in 3 mice. Bar = mean. Error bars = ±SEM. Unpaired two-tailed t-test (p = 0.017). *p < 0.05. e Quantification of the time from arrival under the WHRIL to extravasation into the lung parenchyma for each E0771-GFP EM and SM tumor cell. Left: EM: n = 11 tumor cells in 3 mice. Right: SM: n = 21 tumor cells in 3 mice. Source data are provided as a Source Data file.

