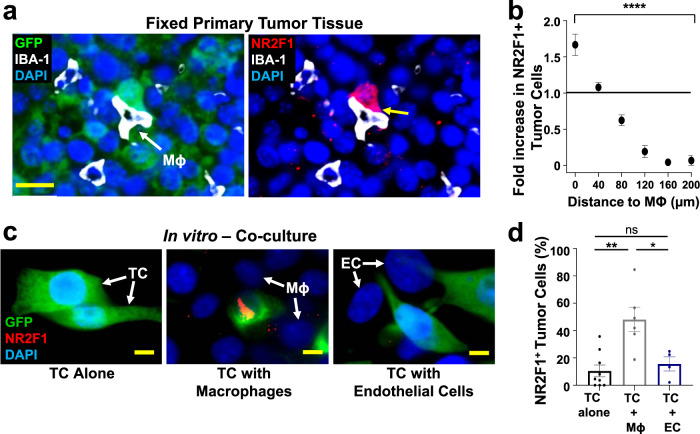
Fig. 7. Macrophages regulate dormancy in tumor cells.
a Representative image of triple immunofluorescently stained in E0771-GFP primary tumor tissue for tumor cells, macrophages, and NR2F1. Green = GFP; Red = NR2F1; White = IBA-1; Blue = DAPI. White arrow shows a macrophage. The yellow arrow shows the contact between an NR2F1-positive tumor cell and a macrophage. Mϕ=Macrophage. Scale bar=20 μm. b Quantification showing the frequency of distances between NR2F1+ tumor cells to the nearest macrophage in the primary tumor. Data is normalized to the frequency of distances between all DAPI+ nuclei to the nearest TMEM. Bar = mean. Error bars = ±SEM. n = 34 fields of view (551 × 316 µm2) in 4 animals. For comparison between the 0 and 200 µm bins a two-tailed Mann-Whitney test was used (p < 0.0001). ****p < 0.0001. c Representative immunofluorescence images of NR2F1 expression in E0771-GFP tumor cells cultured alone, in direct contact with BAC1.2F5 macrophages, or in direct contact with HUVEC endothelial cells. White arrows show macrophages or endothelial cells in direct contact with a tumor cell. Green = GFP; Red = NR2F1; Blue = DAPI. TC = Tumor Cell. Mϕ = Macrophage. EC = Endothelial Cell. Scale bar = 15 μm. d Percentage of NR2F1-positive tumor cells from each group in C. TC alone: n = 777 cells in 9 independent experiments; TC+Mϕ; n = 226 cells in 6 independent experiments, TC+EC = n = 359 cells in 4 independent experiments. Bar = mean. Error bars = ±SEM. For TC vs. TC+Mϕ (p = 0.0039), and for TC vs. TC+EC (p = 1), a two-tailed Kruskal-Wallis test with Dunn’s multiple comparisons adjustment was used. For TC+Mϕ vs. TC+EC (0.012), a two-tailed one-way ANOVA with Sidak’s multiple comparison adjustment was used. *p < 0.05. **p < 0.01; ns = not significant. Source data are provided as a Source Data file.

