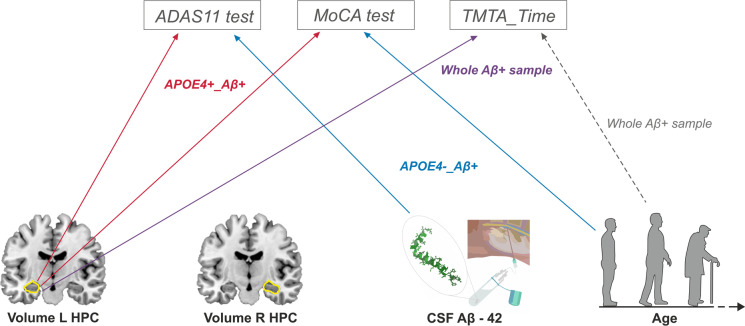
Fig. 2.
Summary of results of the multiple regression analyses of cognitive scores for Aβ + subjects at baseline evaluation timepoint (although the general findings remain the same when taking into account the follow-up data). At the top of the image, the selected cognitive tests are displayed in gray rectangles (ADAS11, MoCA, and TMTA_Time tests). In the bottom, the four factors showing a significant relationship with the aforementioned cognitive tests can be found depicted in a schematic way (from left to right): volume of left hippocampus (HPC), volume of right HPC, CSF_Aβ42, and Age. Lines represent which factors (at the bottom) better explained the variability of which cognitive test (at the top), being color-coded depending on the sample/subsample for which this relationship was found: red for APOE4 + _Aβ + individuals, blue for APOE4 − _Aβ + subjects, violet and gray for the whole Aβ + sample, with the gray dotted line representing a non-significant trend

