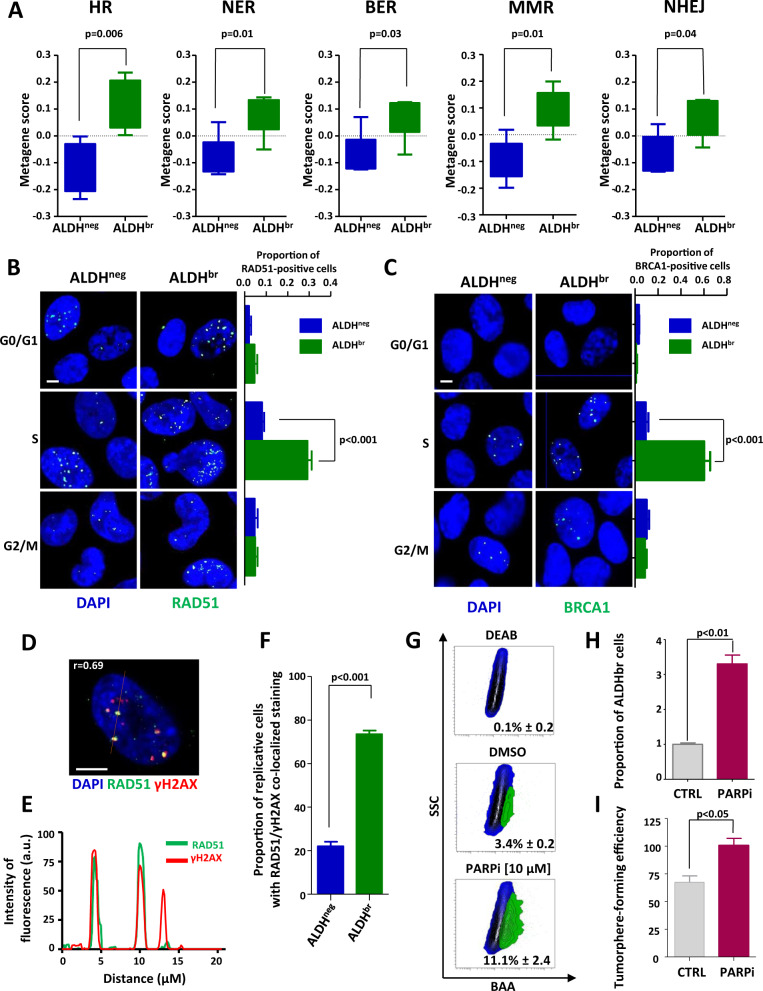
Fig. 2. Replicative ALDHbr bCSCs demonstrated enhanced DNA-repair activity.
A Box plots representing the gene-expression level of DNA-repair pathway metagenes in ALDHbr and ALDHneg cells isolated from PDXs. B, C Representative images of RAD51 foci (B) and BRCA1 foci (C) (green staining) in ALDHbr and ALDHneg cells sorted according to their cell cycle phase (G0/G1, S, and G2/M). Nuclei are counterstained with DAPI (blue staining). Scale bar: 5μm. Bar plots represent the proportion of RAD51-positive cells (B) or BRCA1-positive cells (C) for each cell subpopulation. D Representative images of RAD51 costaining (green foci) with γH2AX (red foci). Nuclei are counterstained with DAPI (blue staining). The red line corresponds to the line scan. Pearson’s coefficient evaluated the amount of colocalization. Scale bar: 5 μm. E Line-scan profile of the relative intensity of RAD51 and γH2AX fluorescent signals. F Bar plot representing the proportion of replicative cells with RAD51/γH2AX colocalized in ALDHbr and ALDHneg SUM159 cells. G Representative examples of flow chart for the ALDEFLUOR staining following PARPi treatment in SUM159 cells. DEAB is an ALDH inhibitor used as negative control. H Bar plot representing the proportion of ALDHbr cells following PARPi treatment compared with the untreated condition (CTRL). I Bar plot representing tumorsphere-forming efficiency (SFE) for SUM159 cells under PARPi-treated and -untreated conditions. Statistical test used is Student’s t-test. Data represent mean ± SD.

