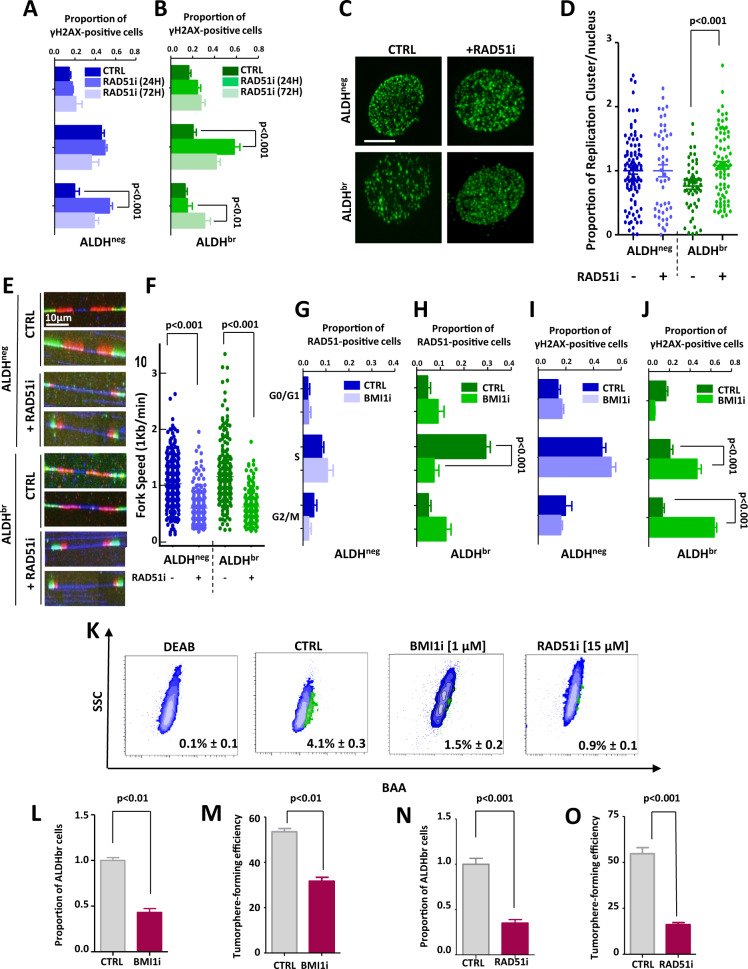
Fig. 4. BMI1/RAD51 axis inhibition enhanced replication stress of ALDHbr bCSCs.
A, B Bar plots representing the proportion of γH2AX foci in ALDHneg (A) and ALDHbr (B) SUM159 cells sorted according to their cell-cycle phases, after 24 h/72 h of treatments with RAD51i or DMSO (CTRL). C–F Quantification of replication-stress markers in ALDHbr and ALDHneg SUM159 cells treated with RAD51i or DMSO (CTRL). C Representative images of active replication clusters (green staining). Scale bar: 5 μm. D Bee-swarm plots representing the proportion of replication clusters per nucleus in each SUM159 cell subpopulation. E Representative images of combed DNA molecules. CldU (green staining) and IdU (red staining) were detected using specific antibodies and DNA is counterstained with DAPI (blue staining). Scale bar: 10 μm. F Bee-swarm plots representing the distribution of fork speed in each cell subpopulation. G–J Bar plots representing the proportion of RAD51-positive (G, H) or γH2AX-positive cells (I, J) in ALDHneg (G, I) and ALDHbr (H, J) SUM159 cells sorted according to their cell-cycle phases, after treatment with BMI1i or DMSO (CTRL). K Representative examples of flowchart for the ALDEFLUOR staining following BMI1i or RAD51i treatment in SUM159 cells. DEAB is an ALDH inhibitor used as negative control. L, N Bar plot representing the proportion of ALDHbr cells following BMI1i (L) or RAD51i (N) treatment compared with the untreated condition (CTRL). M, O Bar plot representing tumorsphere-forming efficiency (SFE) for SUM159 cells under BMI1i (M) or RAD51i (O) treatment compared with untreated conditions (CTRL). Statistical test used is Student’s t-test. Data represent mean ± SD.

