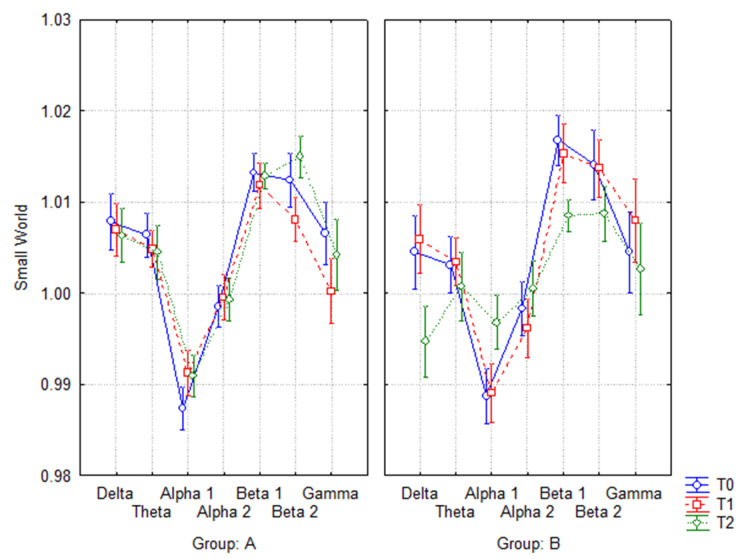
Fig. 3.
ANOVA interaction of Small World index in A (3a) (F(12, 252) = 0.68035, p = 0.76987) and B (3b) (F(12, 144) = 1.9675, p = 0.03126) groups at T0, T1, and T2. The Duncan post hoc analysis showed that in group B, at the last follow-up (T2) compared to baseline (T0), SW values presented a significant decrease in delta (p = 0.028), beta 1 (p = 0.05), and a significant increase in alpha 1 (p = 0.05)

