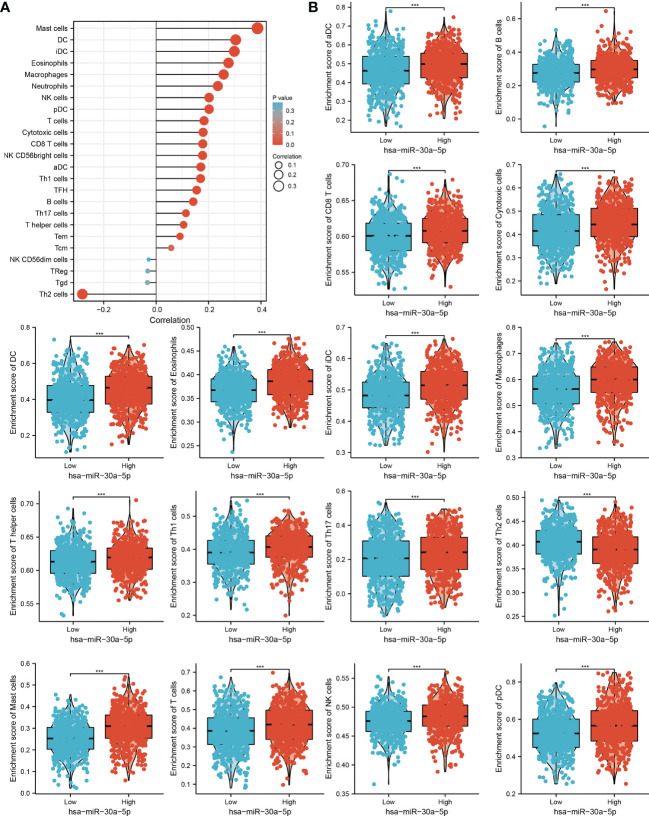
Figure 10.
Analysis of the correlation between miRNA-30a-5p expression and immune infiltration. (A) Correlation between the relative abundances of 24 immune cells and miRNA-30a-5p expression level. (B) Diverse proportions of immune cell subtype in tumor samples in high and low miRNA-30a-5p expression groups.

