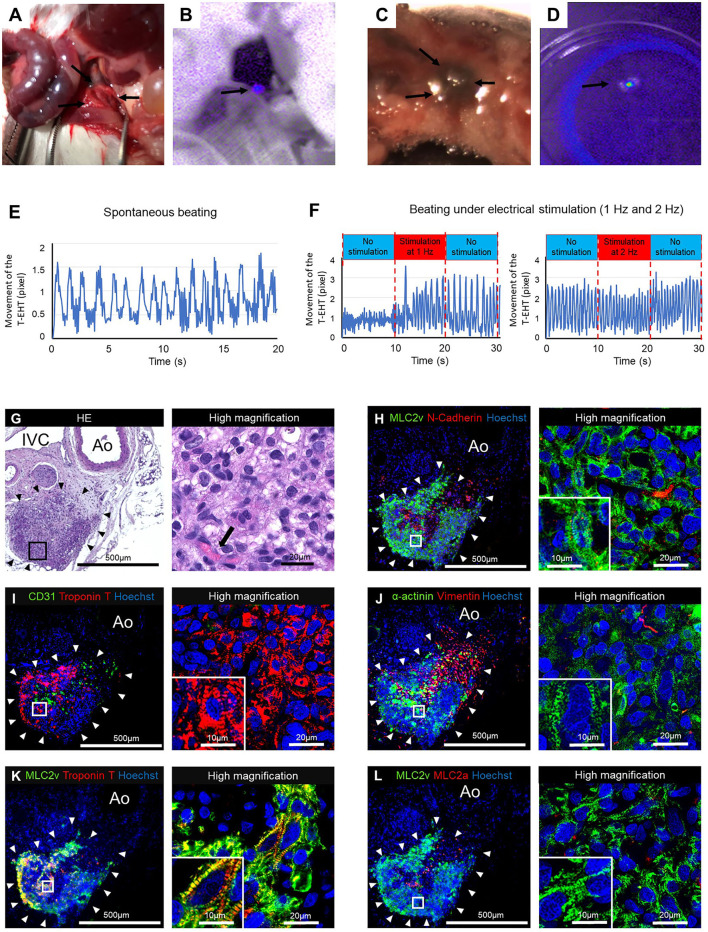
Figure 5.
The tubular engineered heart tissues (T-EHTs) after 4 w of transplantation. (A,B) The T-EHT in vivo, highlighted in fluorescent imaging (black arrows). (C,D) The T-EHT is being explanted with surrounding tissues, and its fluorescence imaging record (black arrows). (E) Beating analysis of explanted T-EHT. The T-EHT showed spontaneous beating. (F) Beating analysis of explanted T-EHT with electrical stimulation. The T-EHT was stimulated with bipolar electrical pulses at 15 V and 1 Hz or 2 Hz for 10 ms. Under electrical stimulation, the beating rate increased to 1.4 Hz at 1 Hz stimulation and 1.8 Hz at 2 Hz stimulation and reduced to 1.1 Hz and 1.6 Hz after stimulation, respectively. Y-axis represents the amounts of movement (in pixels) of the T-EHT recorded using a digital camera. (G–L) Histological staining of T-EHT and its high magnification image. (G) Hematoxylin and eosin (HE) staining. (H) Myosin light chain 2v (MLC2v) and N-cadherin. (I) CD31 and cardiac troponin T (cTnT). (J) α-actinin and vimentin. (K) MLC2v and cTnT. (L) MLC2v and myosin light chain 2a (MLC2a). The HE staining shows engraftment of T-EHT (black arrowheads) and vascularization (black arrow) (G). White arrowheads in the immune staining show T-EHT. Striation of cardiomyocytes are observed in MLC2v, cTnT, and α-actinin staining (H–K). Compared to the T-EHT observed 1 w after transplantation, the number of MLC2a-positive cells is reduced 4 w after transplantation (L).

