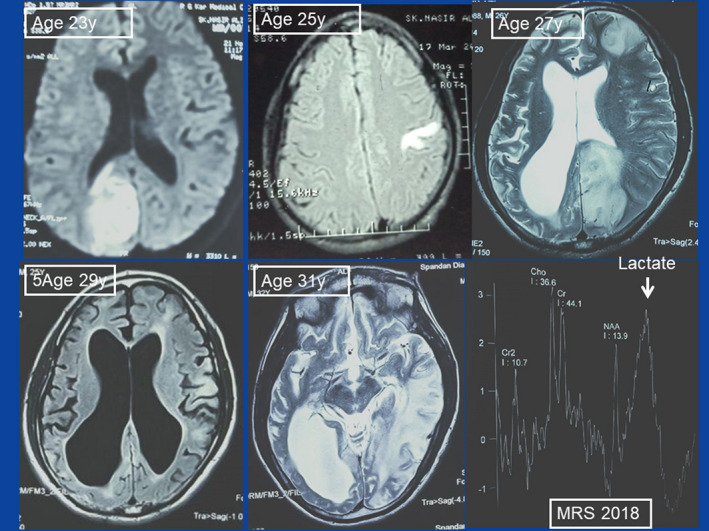
FIGURE 2.

MRI findings at various stages of the disease. Upper middle: the third StLE manifested as cortical hyperintensity in the left post‐central gyrus (3/12). Upper left: the fourth StLE (11/12) showed up as right occipital lesion. Upper right: the fifth StLE manifested as lesion in the left frontal and the left occipital lobe. Lower left: MRI in 5/16 showed internal hydrocephalus, cortical atrophy, and a left parietal and left frontal lesion. Lower middle: MRI in 8/18 showed a hyperintense lesion in the left parieto‐occipital region. All lesions were not confined to a vascular territory. Lower right: MR spectroscopy in 8/18 revealed an elevated lactate peak
