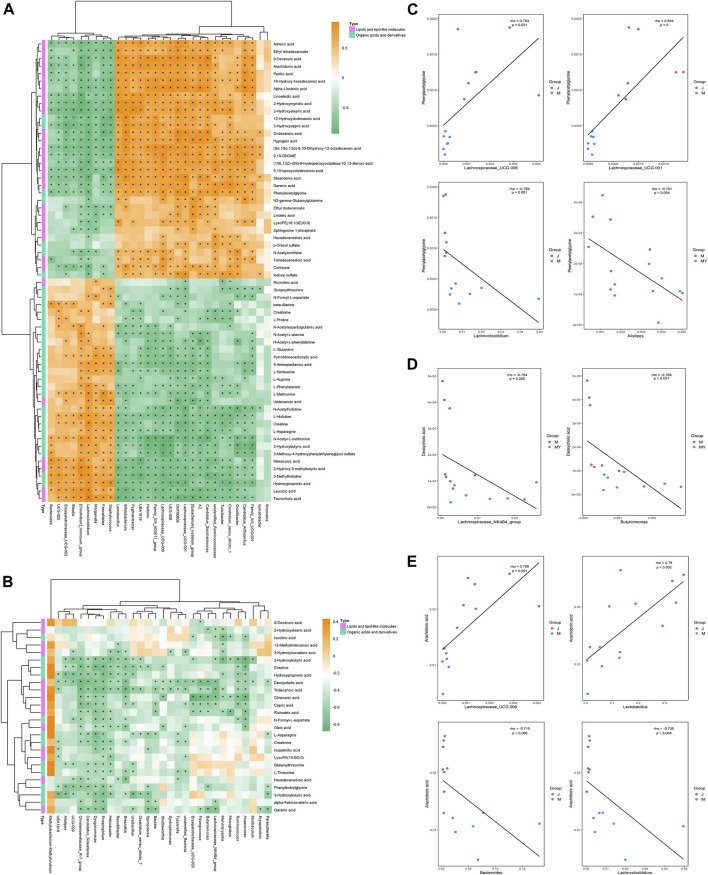
FIGURE 6.
The correlation between gut microbiota and metabolites in development and outcome of stroke. (A) Heatmap of Spearman correlations between the bacteria whose abundances significantly changed in model (n = 8) VS sham (n = 7) group and the 2 type of metabolites (lipids and lipid-like molecules and organic acids and derivatives) with important functions and significant differences. The color bar with numbers indicates the correlation coefficients; (B) Heatmap of Spearman correlations between the discrepant bacteria in model (n = 8) VS NMT (n = 8) group and the 2 type of metabolites; (C) Relationship between intestinal L-asparagine level and Lachnospiraceae_UCG.001 and Lachnoclostridium whose abundances significantly changed in model rats. rho: the spearman correlation coefficient; p: statistical significance. p < 0.05 and |rho| > 0.7; (D) Relationship between intestinal Indoleacetaldehyde level and the four most changed abundant bacterial genera; (E) Relationship between intestinal 2-Hydroxybutyric acid and Creatinine level and the most changed abundant bacterial genera.

