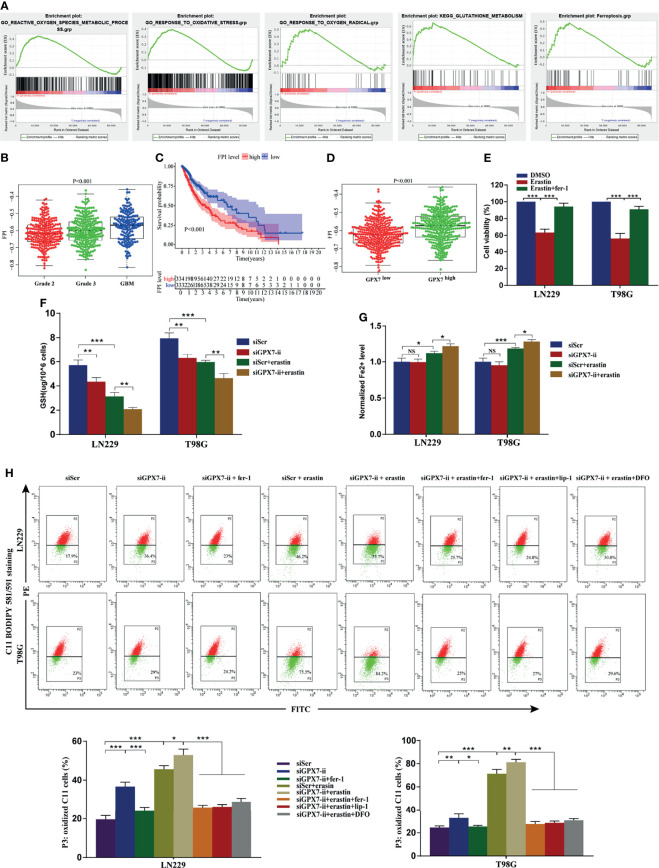
Figure 4.
The association of GPX7 and ferroptosis in glioma. (A–D) Bioinformatics analysis of the association of GPX7 and ferroptosis based on data from TCGA. (A) GSEA of ferroptosis and redox biology related gene sets in cohort with GPX7 high and low. (B) The different FPI levels among different WHO grades of glioma. (C) Kaplan-Meier analysis of OS according to the FPI level. (D) The association of GPX7 expression and FPI level in TCGA glioma samples. (E) CCK-8 assay was used to detect the cell viability of glioma cells treated with erastin (10 μM) for 24 h with or without fer-1 (2 μM). (F) The reduced GSH level in glioma cells subjected to siGPX7-ii transfection with or without erastin (10 μM) treatment. (G) The Fe2+ concentration was measured by FerroOrange probe. (H) Lipid peroxidation was detected in glioma cells subjected to siGPX7-ii transfection with or without fer-1 (2 μM), erastin (10 μM), lip-1 (100 nM) and DFO (100 μM) treatment, using C11 BODIPY 581/591 probe on flow cytometry. Within each chart, cells in P3 region in green represent those stained with oxidized dye. *P < 0.05, **P < 0.01, ***P < 0.001. ns, not significant.

