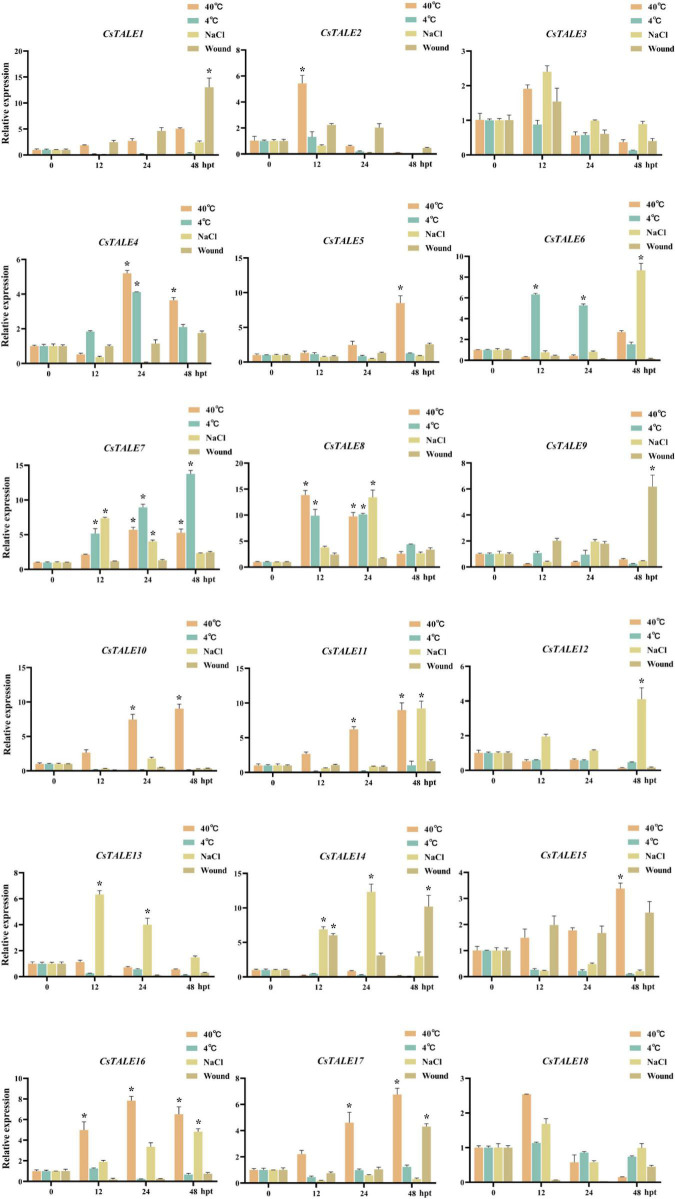
FIGURE 4.
Expression levels of CsTALE genes under different abiotic stress treatment. The Y-axis represent the relative expression level of CsTALE genes and the X-axis indicate different time points post abiotic stress treatment. Different colors represent different stress treatment. The standard errors are plotted using vertical lines. * Represents significant difference (p < 0.05). The experiments in all panels were repeated three times with similar results.

