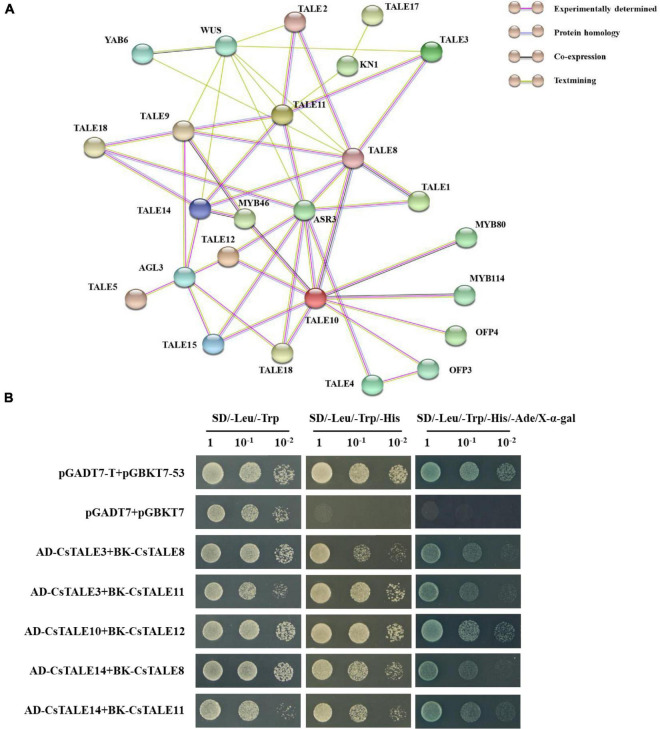
FIGURE 8.
Interaction network and protein interaction of CsTALEs. (A) Interaction network of TALE. Nodes represent proteins, and lines represent protein interaction pairs. Line colors represent different types evidence of protein interaction pairs. (B) Yeast two-hybrid assays. The co-transformed yeast cells were diluted to different concentrations (1, 10–1, 10–2) and cultured in SD/–Leu/Trp, SD/–Leu/Trp/His and SD/–Leu/Trp/His/Ade + X-α-gal medium.

