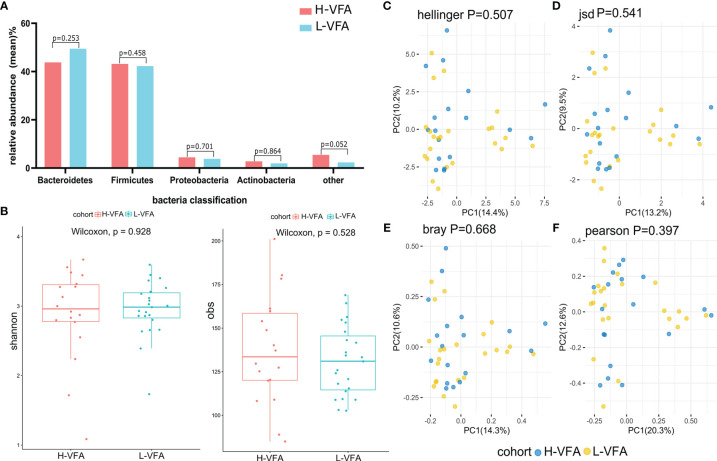
Figure 1.
Microbiome composition and diversity. (A) No significant differences were found in the phyla of the H-VFA group and L-VFA group (p > 0.05). (B) Both Shannon index and obs index measured alpha diversity in comparisons between the H-VFA group and L-VFA group. There was no significant difference in the level of microbial species between the two groups (p = 0.928 and p = 0.528). (C–F) Beta diversity between the H-VFA group and L-VFA group. Beta diversity was calculated based on the Hellinger distance, JSD distance, Bray distance, or Pearson distance. There were no significant differences between the H-VFA group and the L-VFA group.

