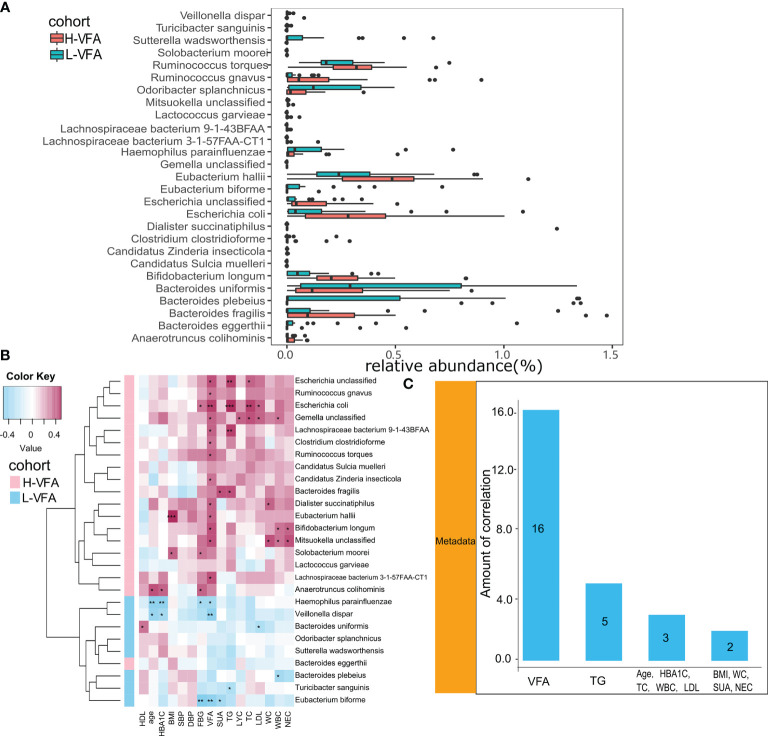
Figure 2.
(A) The relative abundance of bacterial species between the H-VFA group and the L-VFA group. Wilcoxon test analysis of the relative abundance of bacterial species showed significant differences in 27 species, with nine species enriched in the L-VFA group and 18 enriched in the H-VFA group. (B) Correlations between bacteria and clinical characteristics. Pink cells denote positive correlations, whereas blue cells depict negative correlations. *, **, and *** denote p < 0.05, p < 0.01, and p < 0.001, respectively. (C) The number of significant correlations for the eleven risk factors.

