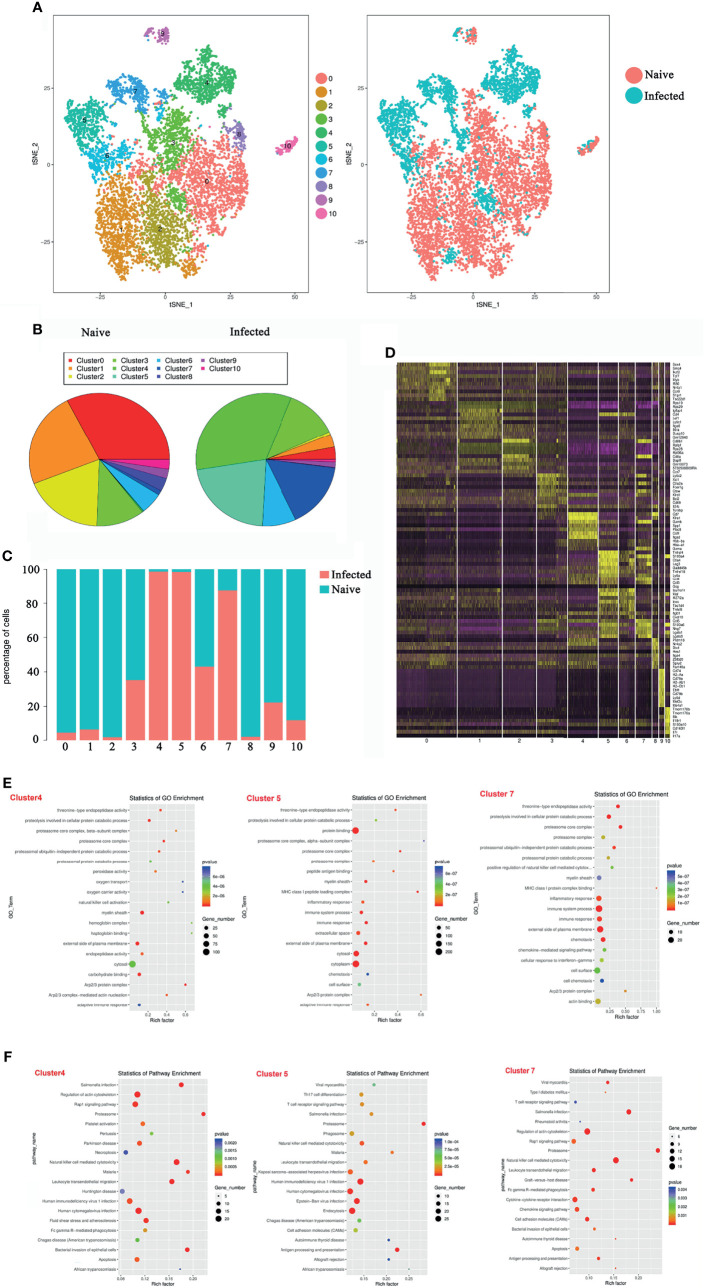
Figure 3.
Single-cell transcriptomic analysis of splenic γδT cells from P. yoelii NSM infected mice. At 14 days after P. yoelii NSM infection, splenocytes were isolated from both naive and infected C57BL/6 mice. CD3+γδTCR+ cells were sorted using FACS, and the expression profile in single cells was detected using single-cell RNA sequencing (10× Genomics Chromium system). (A) t-distributed stochastic neighbour embedding visualization (t-SNE). All isolated γδT cells were classified into 11 clusters according to the properties of the RNA expression profile in each cell. Different colours represent different clusters, as indicated by the label (left). The cells from naive (red point) or infected (blue point) mice in each cluster are shown (right). (B) The percentage of cells in each cluster from naive (left) or infected (right) mice. (C) The ratio of each cluster in γδT cells from naive (blue) or infected (red) mice. (D) The heatmap of marker genes in each cell cluster. (E) The top 20 significant GO terms for the marker genes from 4, 5 and 7 cluster. The GO enrichment analysis revealed that the marker genes in each cluster were involved in innate and adaptive immunity. The left represents the GO term, the right represents enrichment, and the size of the solid circle indicates the number of genes. (F) The top 20 significant KEGG pathways for the marker genes from 4, 5 and 7 cluster. The KEGG pathway of marker genes in each cluster. The left represents the KEGG pathway, the right represents enrichment, and the size of the solid circle indicates the number of genes. A single experiment was performed for scRNA sequencing.

