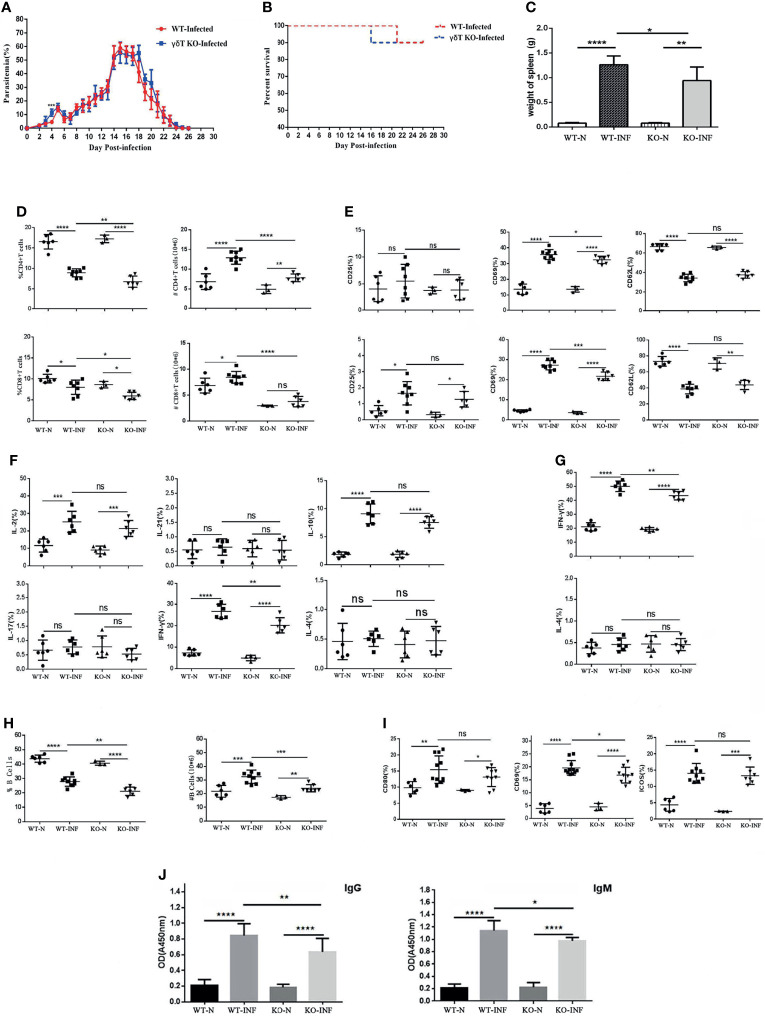
Figure 4.
γδTCR KO decreased splenic T cell response and B cell response in P. yoelii NSM infected mice. Dynamic monitoring of percent parasitaemia (A) and percent survival (B) in wild-type C57BL/6 and γδTCR KO mice, which were both infected with Plasmodium yoelii NSM. *P<0.05. Representative results of two independent results are shown (N=10). (C) Mice were infected with P. yoelii NSM, and 14 days later, spleens were separated from both naive and P. yoelii NSM infected wild-type and KO mice. The weights of the spleens from each group of mice were measured (N=5-6). (D) FCM statistical graphs of the distribution and content of splenic CD4+ T cells and CD8+ T cells in the two infected and two naive groups. # refers to absolute number. (E) The expression levels of CD69, CD62L and CD25 on CD4+ T cells and CD8+ T cells in P. yoelii NSM infected mice compared with the two naive groups. (F, G) The cytokine expression levels of IFN-γ, IL-2, IL-4, IL-10, IL-17, and IL-21 in CD4+ T cells and CD8+ T cells obtained from Plasmodium-infected mice compared with the two naive groups. (H) The percentage and content of B cells in each group of mice were detected by FCM and counted. (I) The expression levels of CD69, ICOS and CD80 in B cells in each group of mice were detected by FCM. (J) Serum from both naive and infected C57BL/6 and γδTCR KO mice was collected and diluted 100 times. The contents of malaria-specific IgM and IgG antibodies were detected by ELISA. The OD values are shown. Representative results of three independent results are shown (N=5) and the error bars are SD. ****P < 0.0001, ***P < 0.001, **P < 0.01, *P < 0.05, ns, P > 0.05.

